Potential- Induced Degradation

Potential- Induced Degradation

Icon

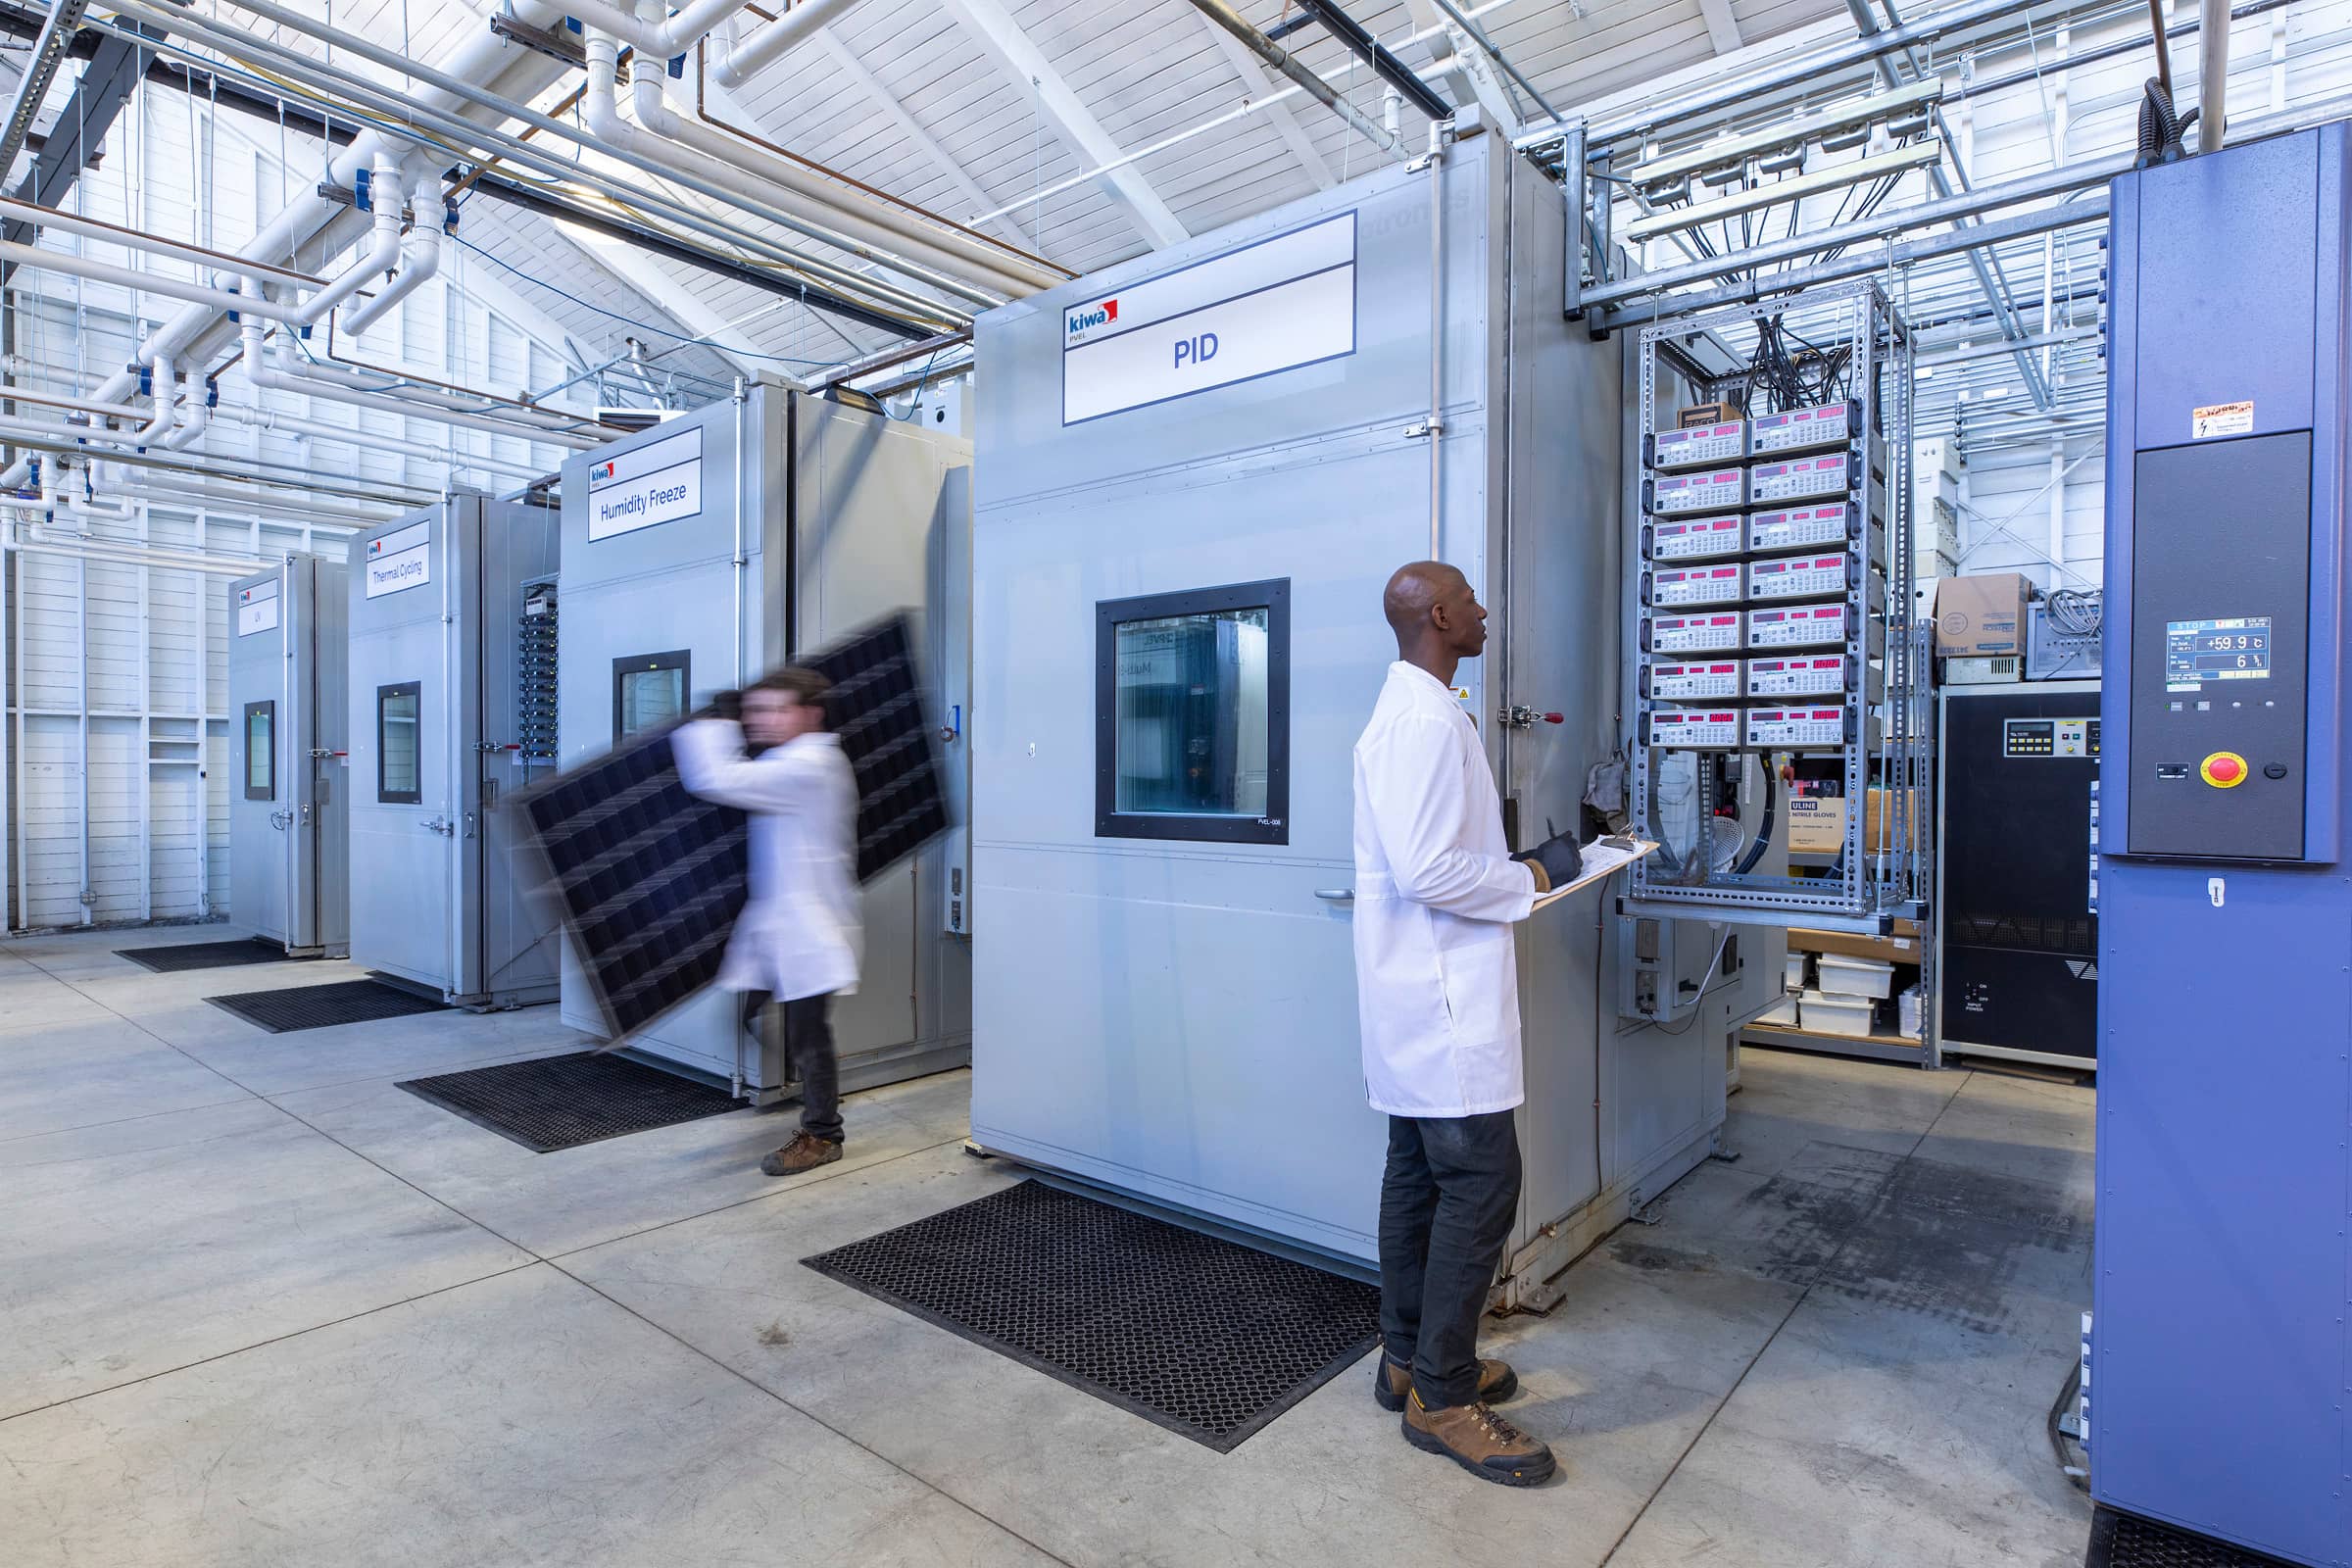
The PQP’s Potential Induced Degradation (PID) teest doubles the IEC/UL certification test duration to 192 hours. PID occurs primarily in electrically ungrounded PV systems with high voltages, especially those using transformerless inverters. There are multiple forms of PID, including PID-shunting and PID-polarity. PID-shunting occurs when sodium ions from the glass travel to pinholes in the anti-reflective coatings on the cells, permanently lowering performance. PID-polarity is static charge build-up due to internal circuit voltages, and is possibly reversible.

Key
Takeaways

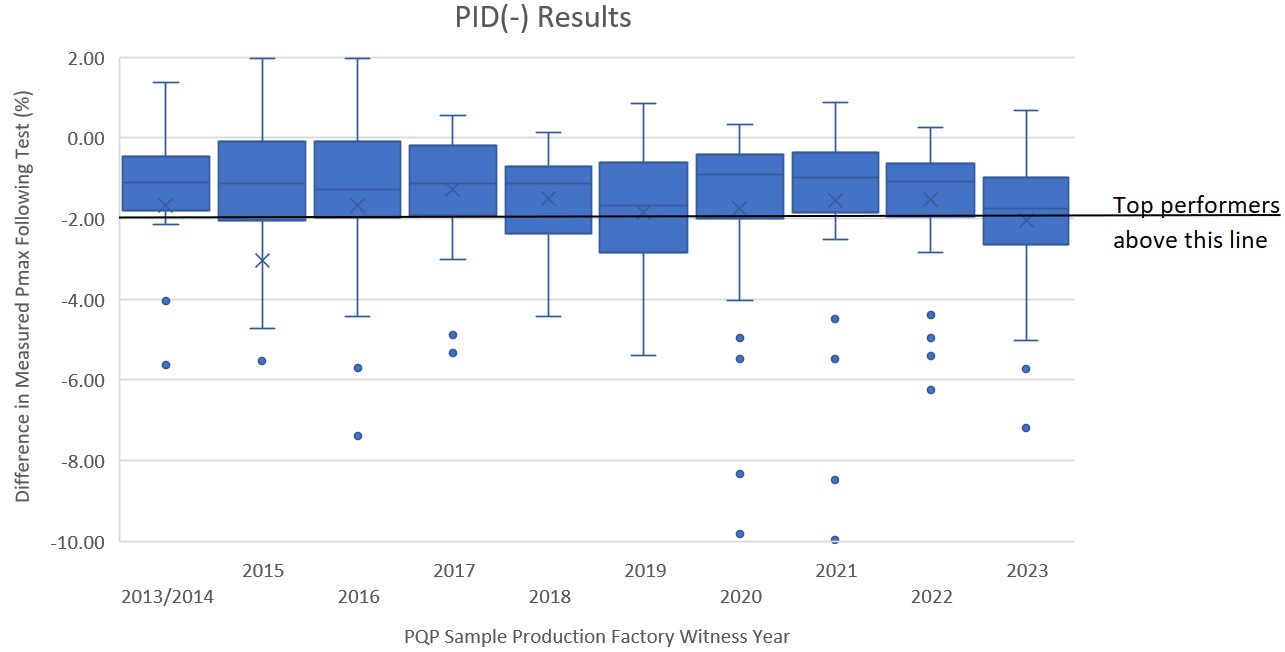
Only 58% of BOMs tested degraded by < 2%.

This is a significant decrease from the 79% of BOMs reported in last year’s Scorecard. The median degradation following PID increased from 1.1% for BOMs produced in 2022 to 1.8% for BOMs produced in 2023, and the average degradation increased from 1.6% to 2.1%. See the Power Degradation graph below for more. See the Power Degradation graph below for more.

Test Result Spotlight

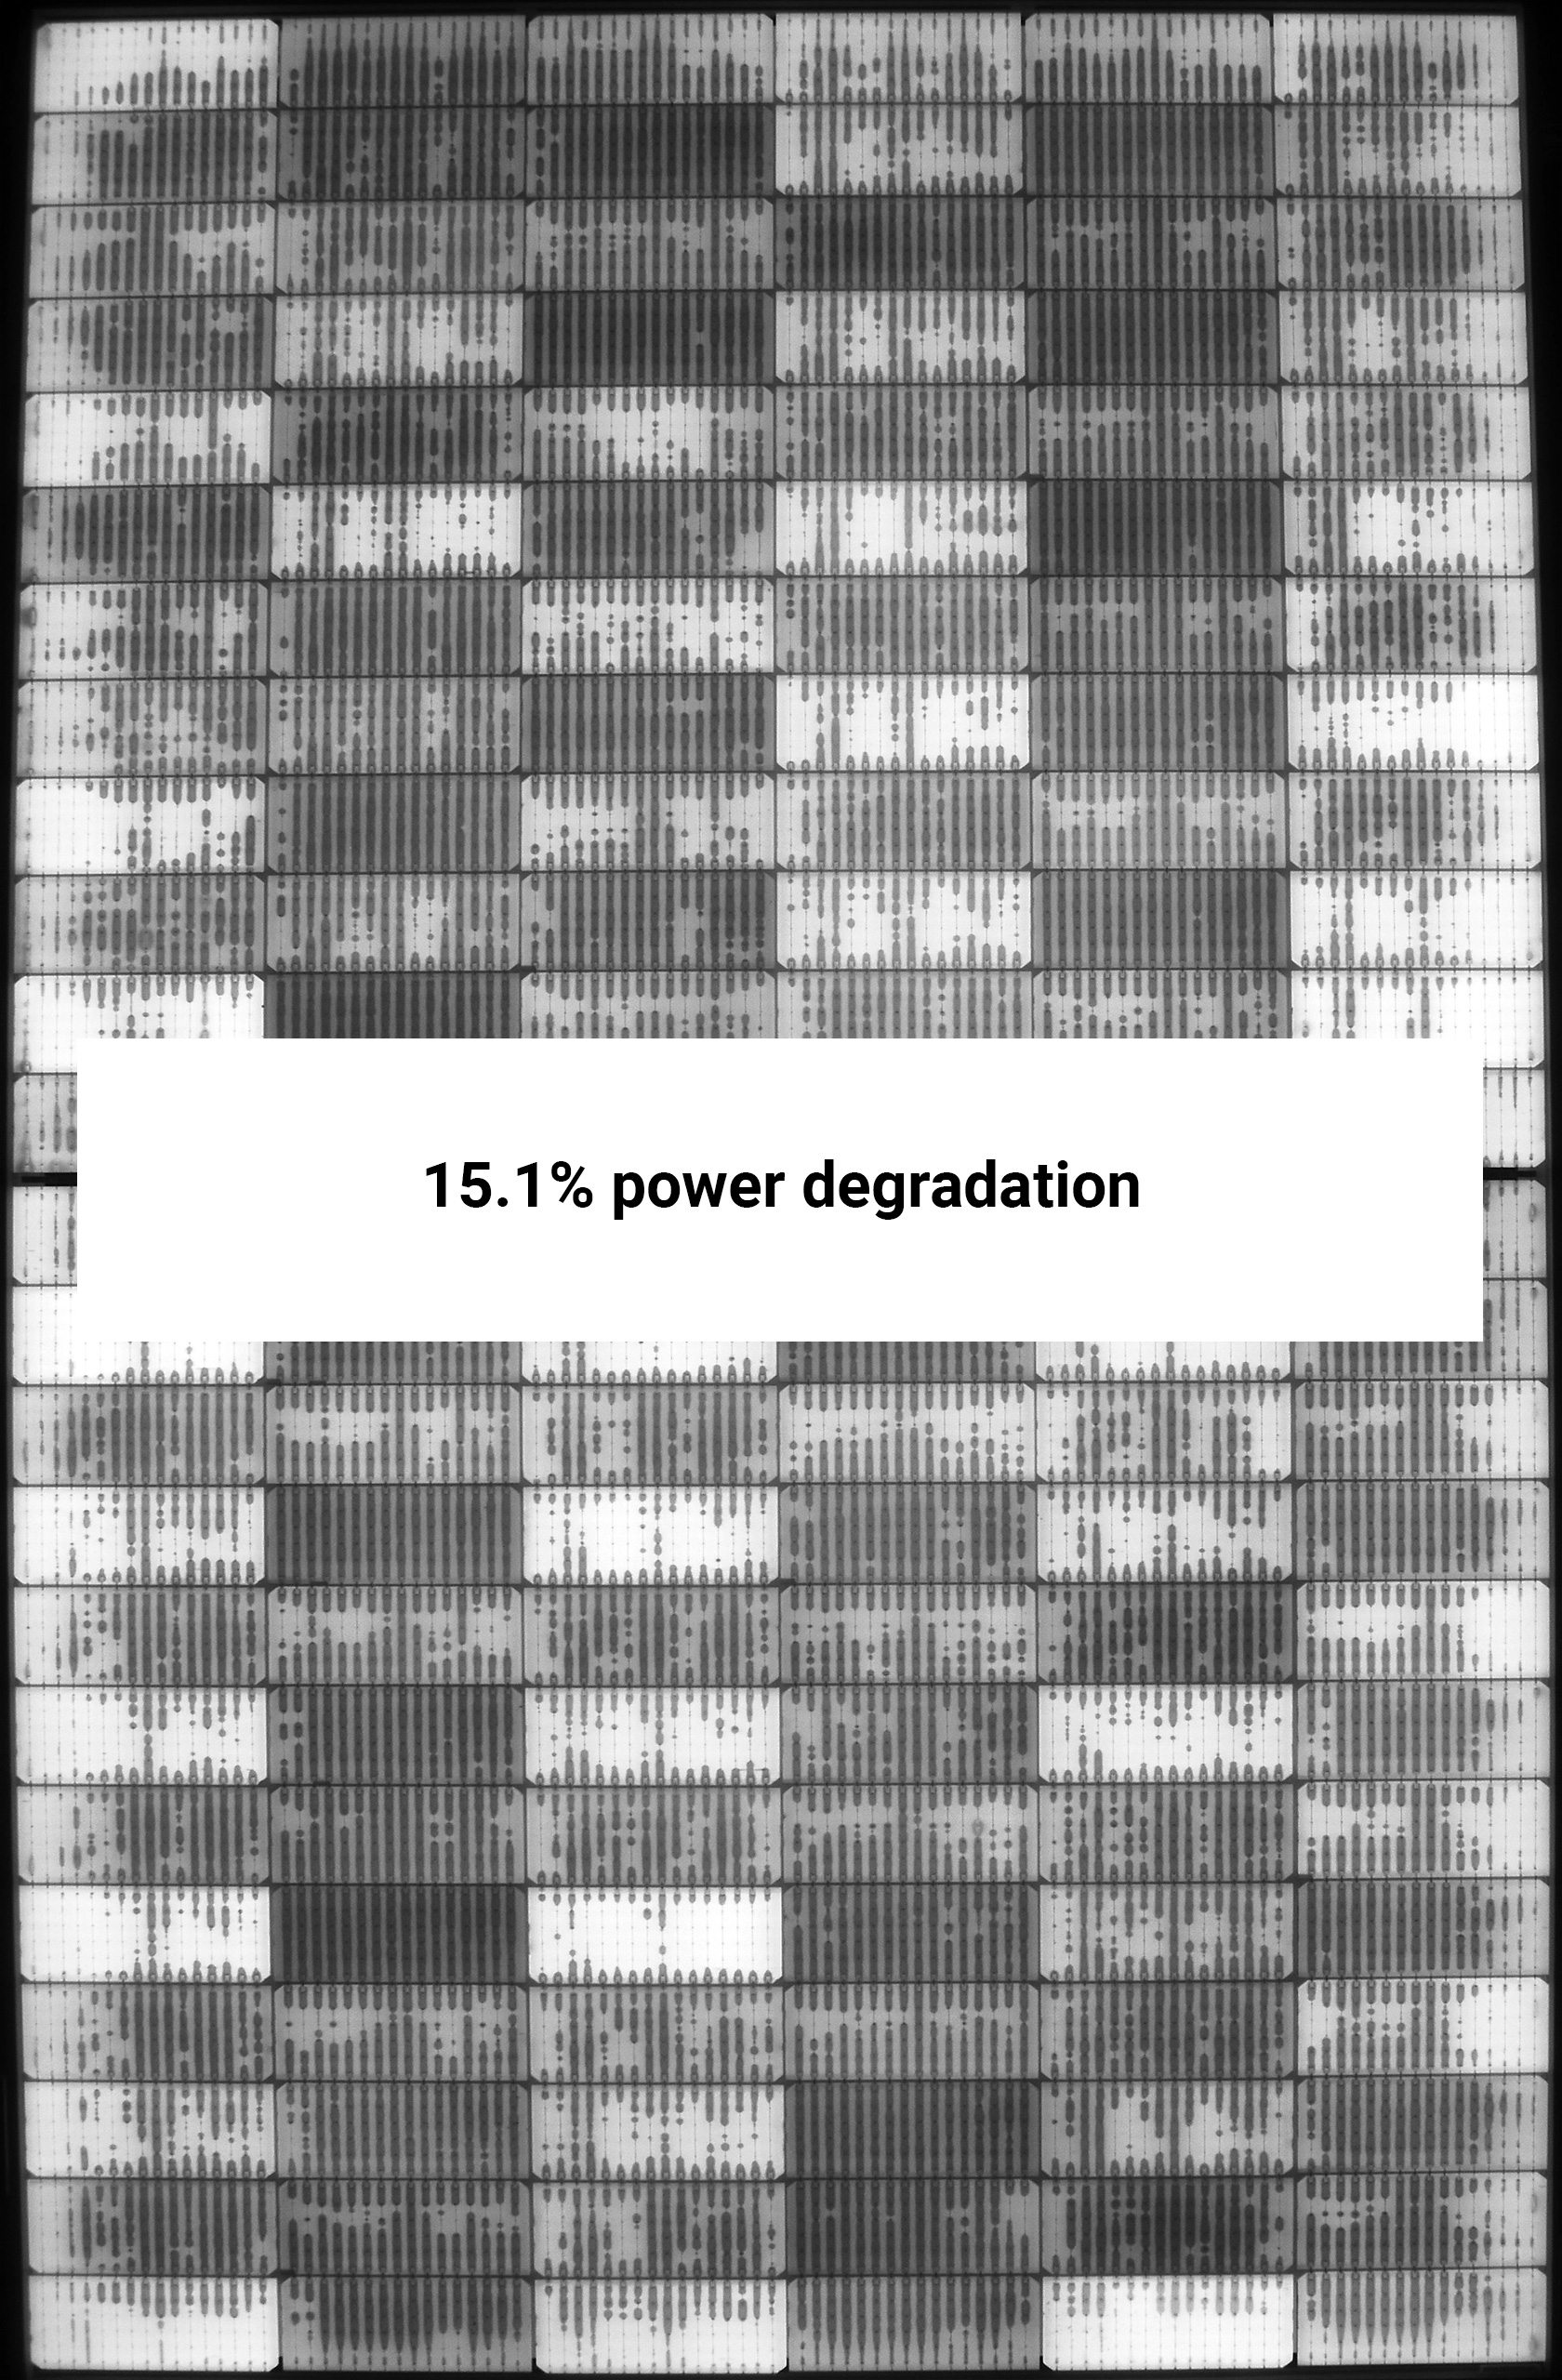
Potential induced degradation can take many forms, including PID-s (shunting), PID-c (corrosion), and PID-p (polarization). Recent PQP testing has revealed an increasing number of BOMs that are susceptible to PID-p, including the TOPCon module shown here. Kiwa PVEL’s testing has confirmed that many BOMs do not exhibit PID-p, but others can suffer a significant amount of power loss. While a subsequent short duration exposure to UV light can often reverse this effect, some research has shown examples of PID-p occurring in the field.
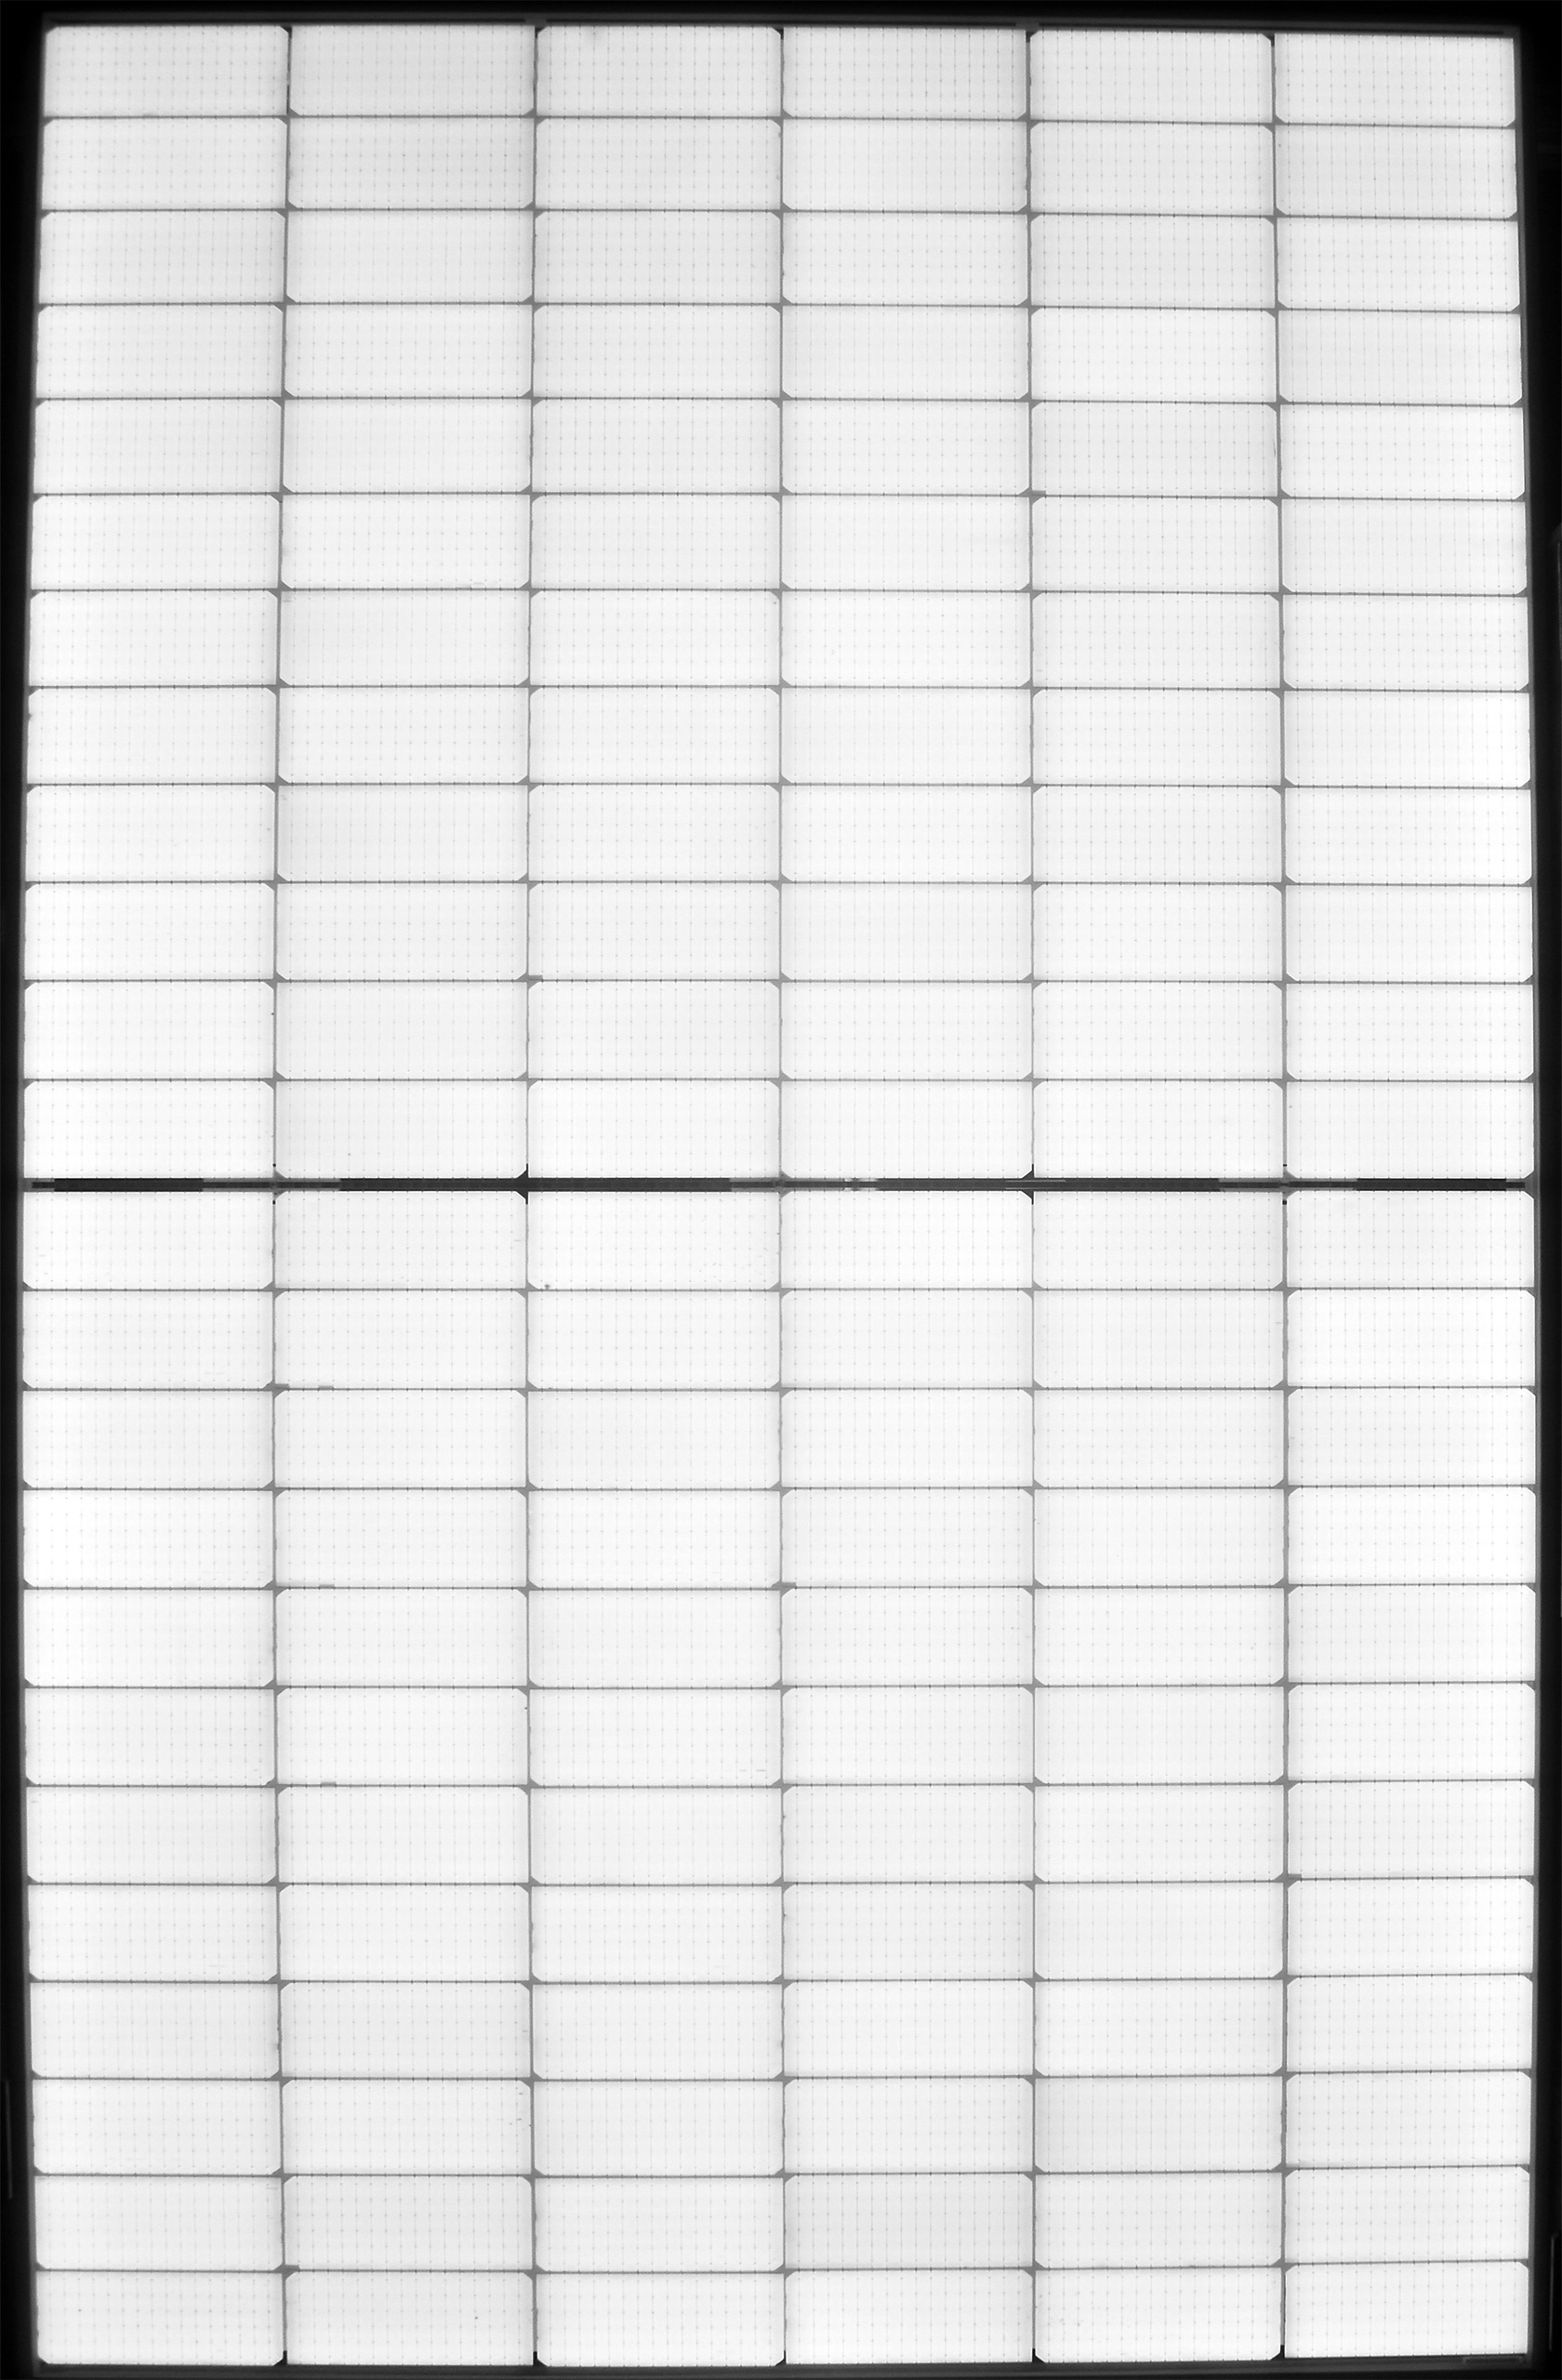
PRE-STRESS

Test Result Spotlight

The pre-stress image shows a perfect module with no EL anomalies.

PID192(-)

Test Result Spotlight

After 192 hours of PID(-) testing, most cell bus bars show an accumulation of polarization charges.

Power Degradation of PID BOMs

Power degradation chart for PID stress sequence

All 2013/2014 and 2015 results are from 600 hours of PID testing. This was decreased to 192 hours for 2016 results and beyond. Outliers with >10% degradation are not shown. In some cases, these cause a significant reduction in the mean.

View Box Plot Interpretation Guide

A case study on why PID is important, what PV module materials are assessed, and the test procedure can be found here on kiwa.com/pvel.

Kiwa PVEL Top Performer

See PID Top Performers

Click here to see the 145 model types listed as PID Top Performers.

Procure better modules. Get access to the
Scorecard data every quarter.

Sign up as a Kiwa PVEL Premium Partner

SIGN UP →

Continue Exploring the 2024
Scorecard

NEXT PAGE →