
Test Result Spotlight
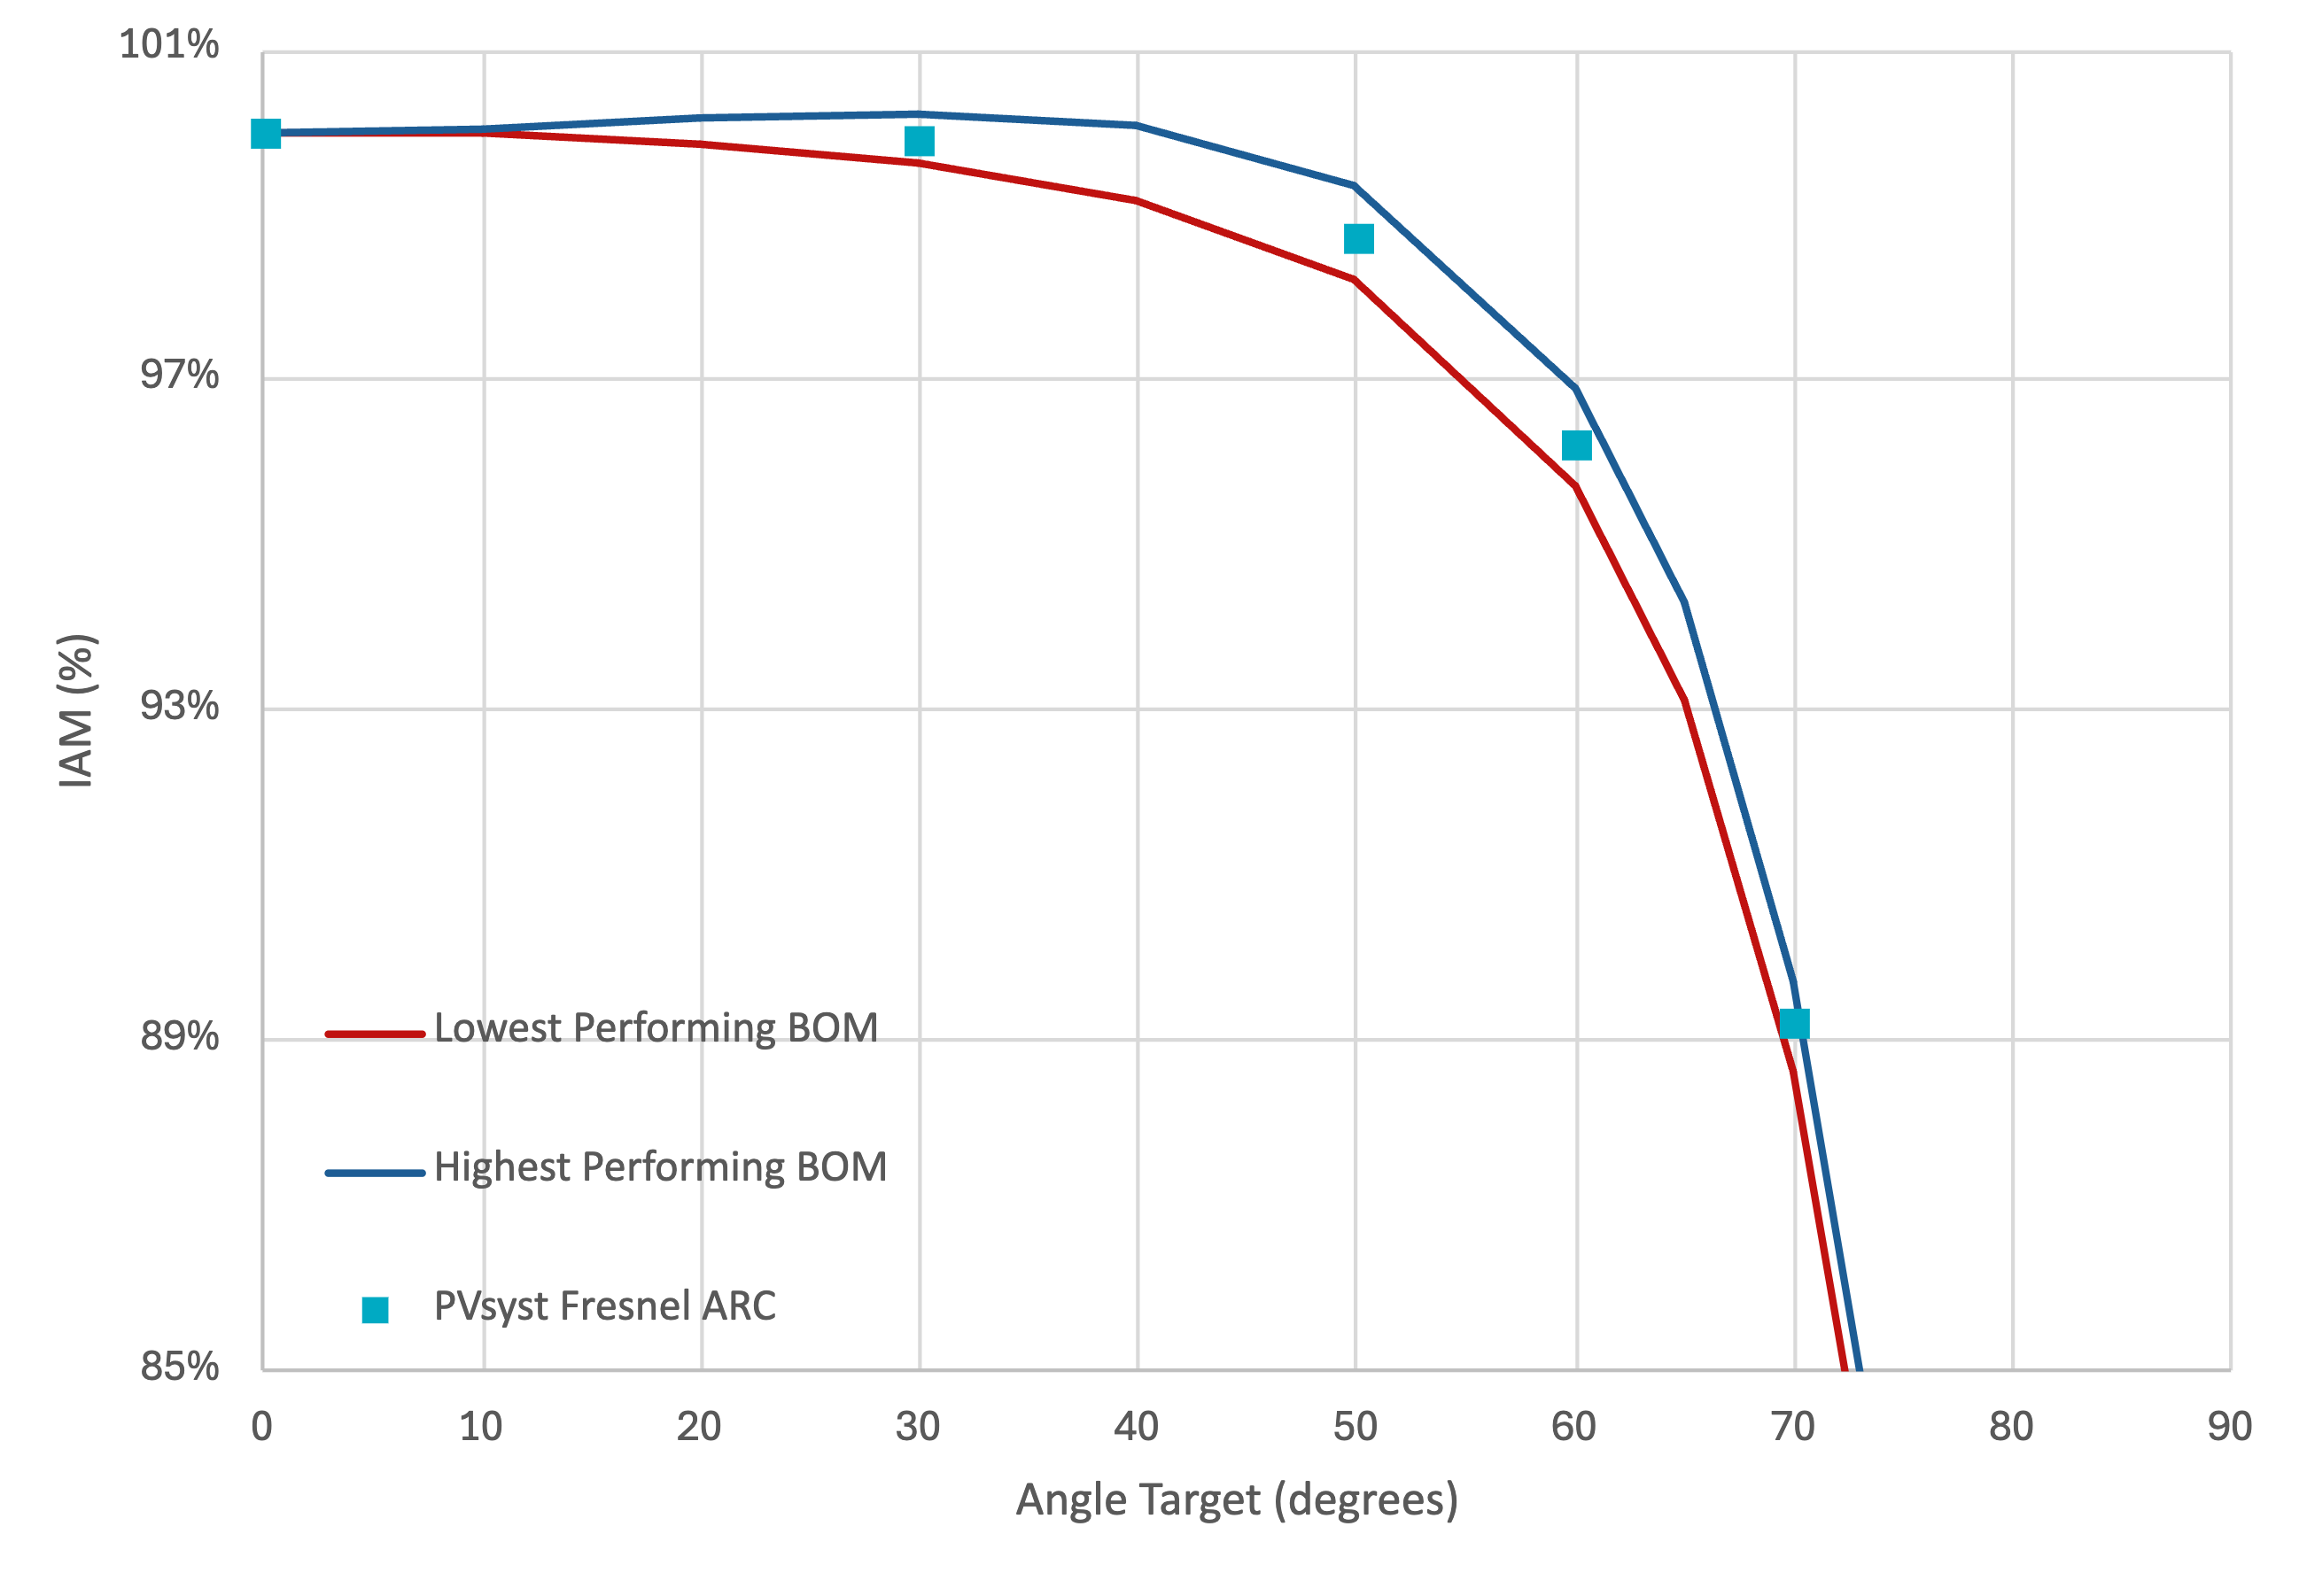
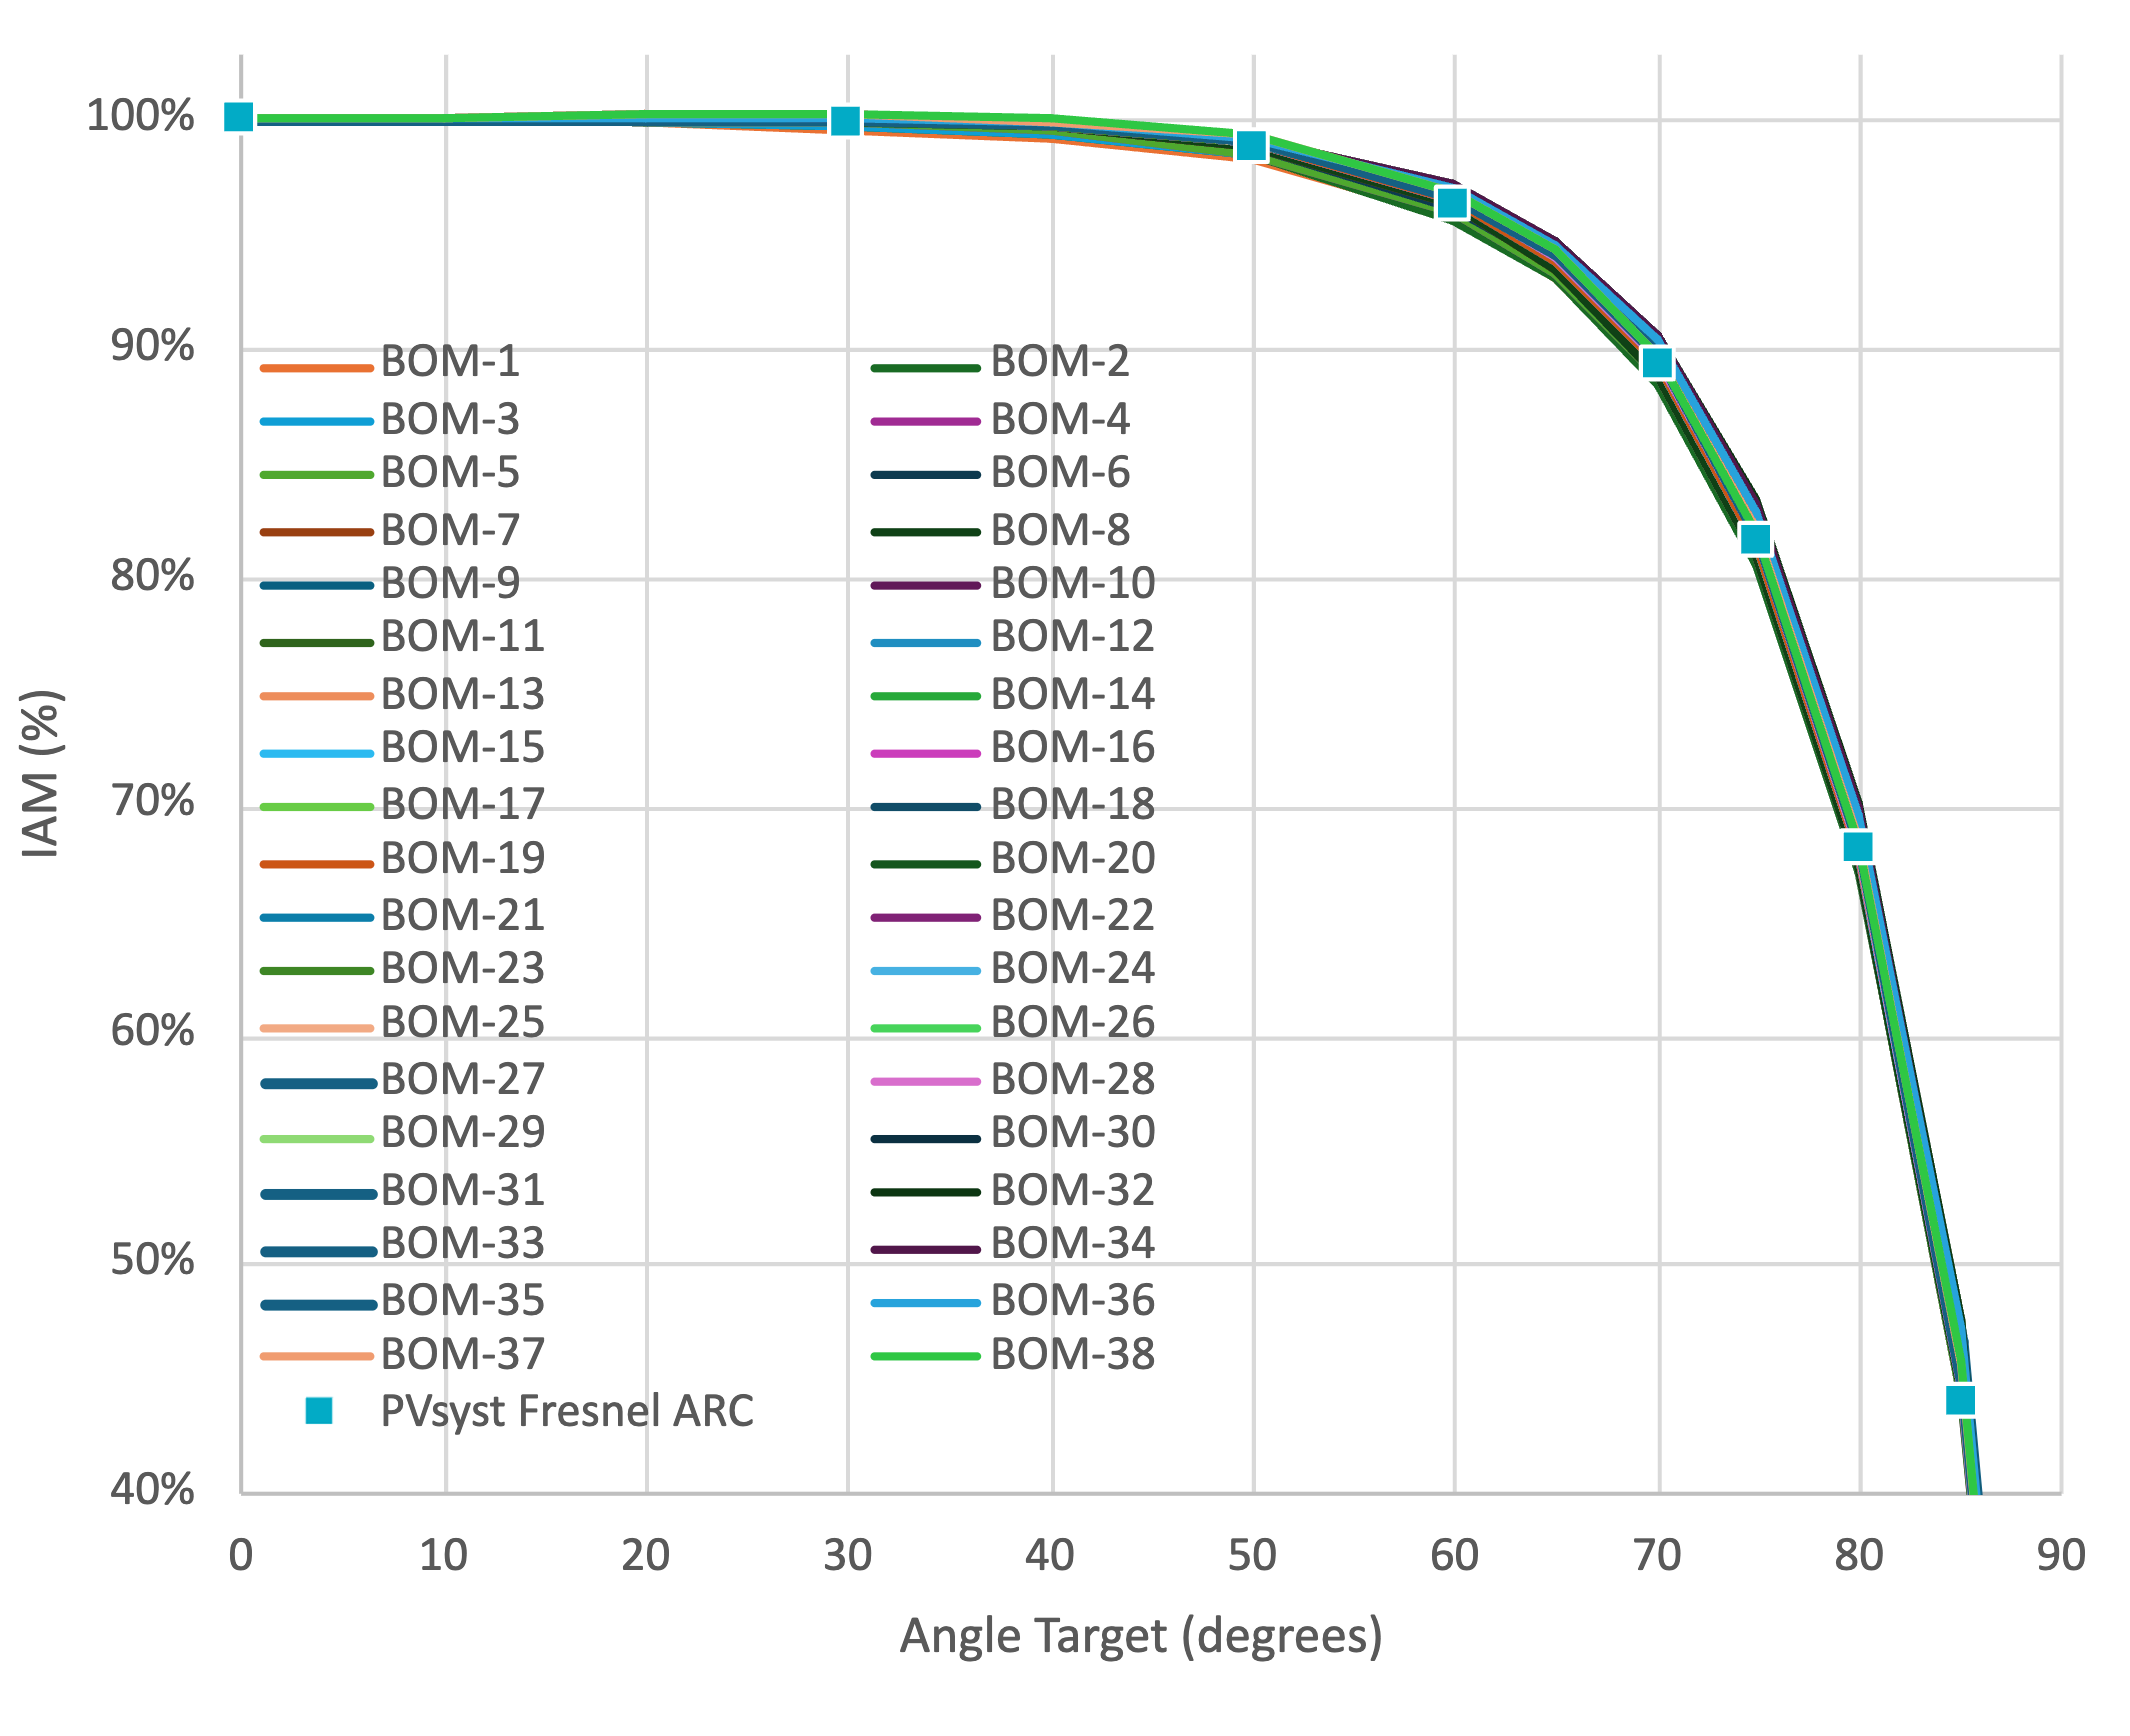
The consistency across Kiwa PVEL’s IAM measurements may surprise some in the industry who are used to seeing more aggressive IAM values. But despite the relative closeness in IAM measurements, the differences between BOMs can still be significant for project energy and financial models. The zoomed-in IAM graph below compares the lowest and highest performing BOMs that Kiwa PVEL has measured since launching our upgraded IAM test in 2023. Compared to energy models using the PVsyst Fresnel ARC default, the worst performer results in 0.24% lower energy yield and the best performer results in 0.28% higher energy yield when modeled using PVsyst on a single-axis tracking system in Las Vegas, NV.