The module frame and glass broke during DML testing, after being weakened during SML.
Key Takeaways
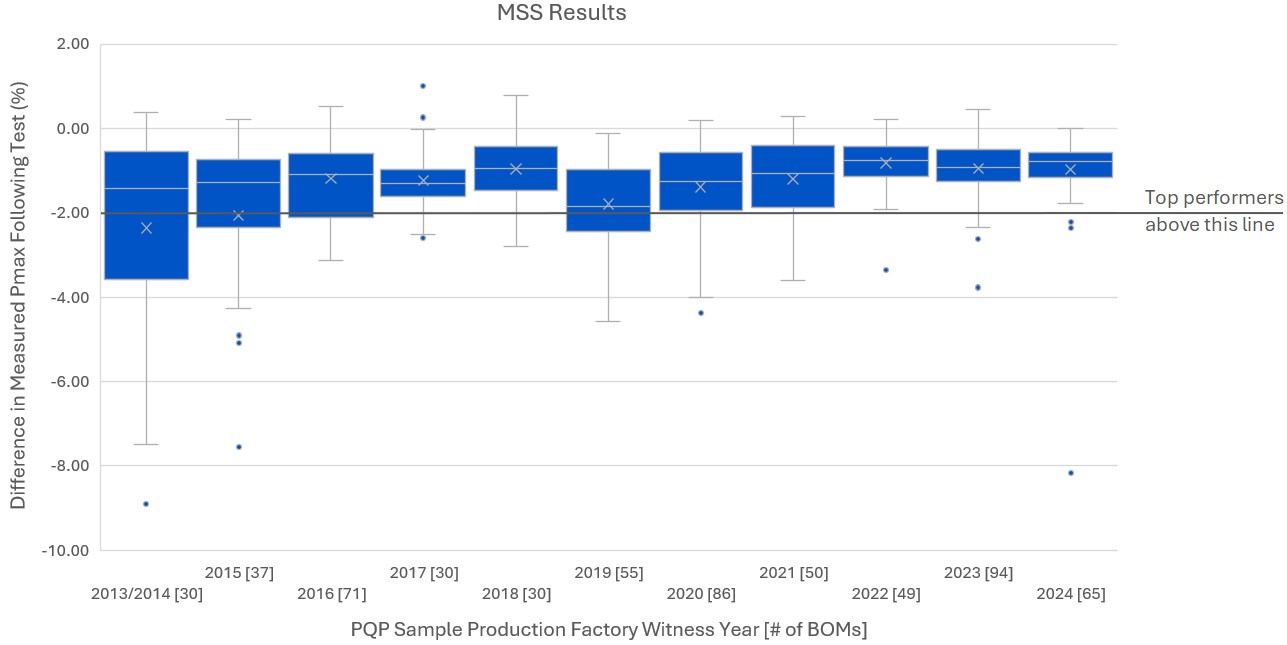
Minimal Power Loss
94% of BOMs completing MSS had < 2% power loss.
The power loss following MSS has remained relatively minimal for the past three years due to glass//glass and/or multi-busbar modules. However, two glass//backsheet BOMs experienced >8% power loss when the modules pressed against the torque tube, leading to many cracked cells with inactive areas. See the Power Degradation graph below for more.
Failures Spike
20% of BOMs experienced one or more failures during MSS testing.
The BOM-level failure rate increased from just 7% in the 2023 and 2024 Scorecards. 40% of manufacturers experienced at least one failure during MSS testing, all but two of which were due to glass breakage and/or frame damage (see the Test Result Spotlight below). Tracker-mounted load testing of larger modules with weaker glass and/or frames was to blame. See the Failures page for more.

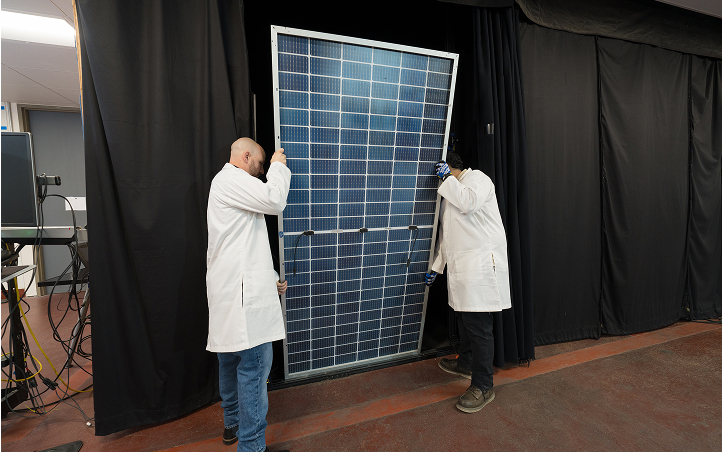
Mounting Matters
Increase in glass breakage with tracker-mounted testing.
The sharp increase in the rate of broken modules came after updating the static mechanical load portion of the MSS test to use 400 mm Nextracker mounting at a ±1800 Pa test load, versus the previously used two-rail mounting with 50 mm clamps at a ±2400 Pa test load. This change in test procedure has highlighted the importance of mechanical durability.
Glass Breakage Reasons
Many possible reasons exist for the increase in glass breakage in the lab and the field.
Kiwa’s analysis of broken modules from the lab and field supports NREL’s recent work1 on this topic. While there is no single reason, a range of issues have been identified including reduced glass strengthening, flaws within the glass edge and junction box mounting holes, weaker frame designs, laminate edge pinch, larger module areas, more aggressive module mounting and contact between the glass and frame.
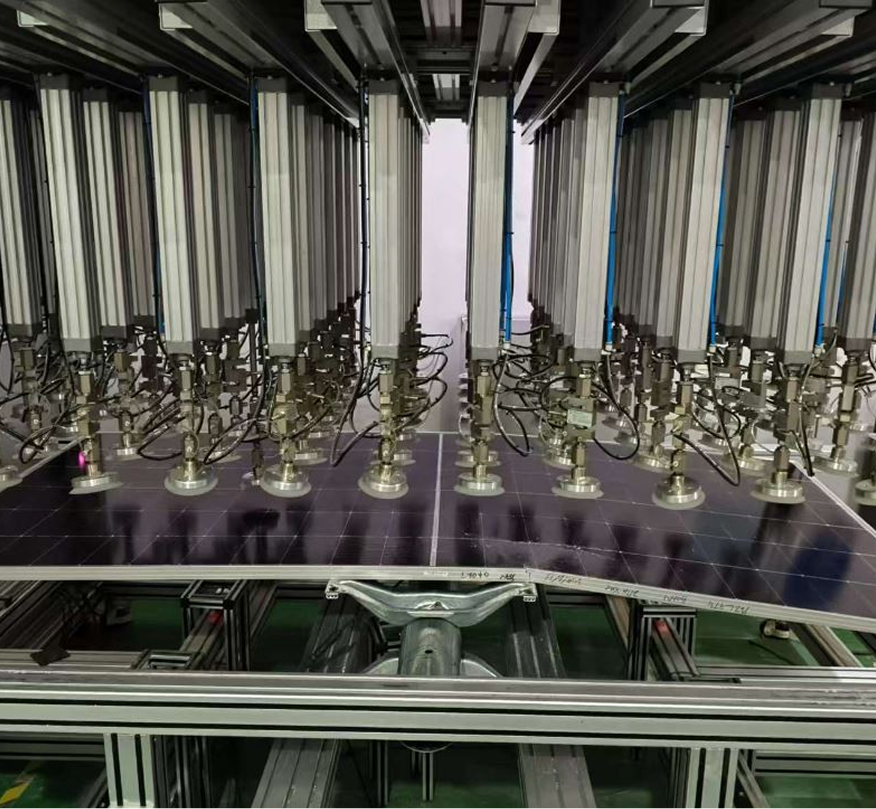
MSS Test Result Spotlight
For some BOMs, module breakage occurs due to glass weakness, while for others, the frame is the main contributor. A case of the latter is below, where, following tracker-mounted ±1800 Pa SML, the frame experienced an oblique fracture 300 cycles into the ±1000 Pa DML test. Similar module failures have been observed in the field following wind events, and are likely due to thinner frame walls, smaller frame flanges and/or lower strength aluminum alloys. This type of defect may not appear during separate SML or DML testing for IEC certification, but has been seen on multiple modules subjected to the PQP’s combination of SML and DML.
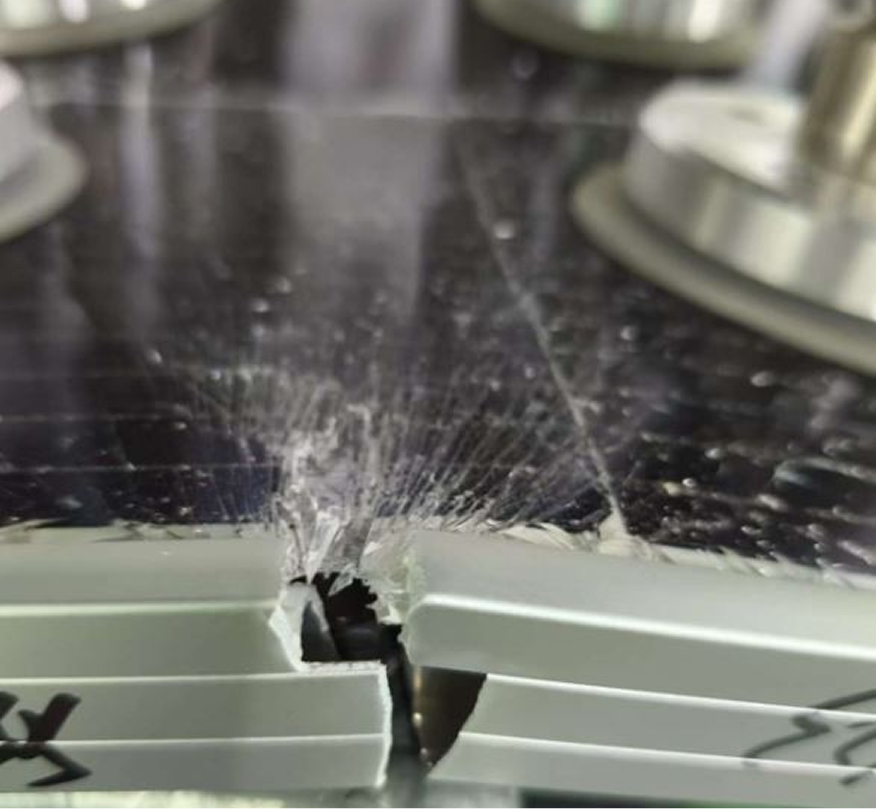
Zooming in, a clear break in the frame can be seen.

1 Silverman, T., Palmiotti, E., Springer, M., Bosco, N., Deceglie, M., Repins, I., & Gaulding, A. (2024). Tough Break: Many Factors Make Glass Breakage More Likely. https://doi.org/10.2172/2479454