Become a Kiwa PVEL Premium Partner
Premium Partners receive full BOM-level data every quarter.
The PQP failure rate continued to increase over the past year, with 87% of manufacturers and 61% of BOMs experiencing one or more failures. These are up from the record high of 83% and 59%, reported in the 2025 Scorecard. Module breakage during MSS and HSS testing continued to be the top failure mode, but a sharp increase in delamination defects made it a close second in failure occurrences.
manufacturers with at least one PQP failure
BOMs with at least one PQP failure
manufacturers with at least one delamination failure
Modules with safety failures may be hazardous to operate in the field. Throughout PQP testing, safe operation is determined via wet leakage testing using the IEC 61215 standard, which evaluates the electrical insulation of the PV module. BOMs not meeting the IEC 61215 minimum requirements for insulation resistance are included in the Scorecard's failure statistics.
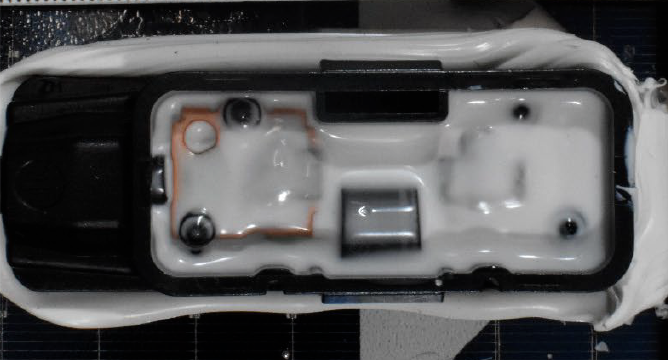
This module failed wet leakage testing at initial characterizations, meaning that no stress testing was required to identify the issue. Kiwa PVEL's investigation revealed that the pottant inside the junction box was insufficient, leading to exposed electrical circuitry inside the junction box. Wet leakage failures traced to the junction box were detected on BOMs from 9% of manufacturers within the past year.
Visual inspections identify issues that cause premature field failure. Modules are examined for delamination, corrosion, broken or cracked surfaces and other 'major' defects using the IEC 61215 and IEC 61730 criteria. BOMs exhibiting 'major' visual inspection findings are included in the Scorecard's failure statistics.
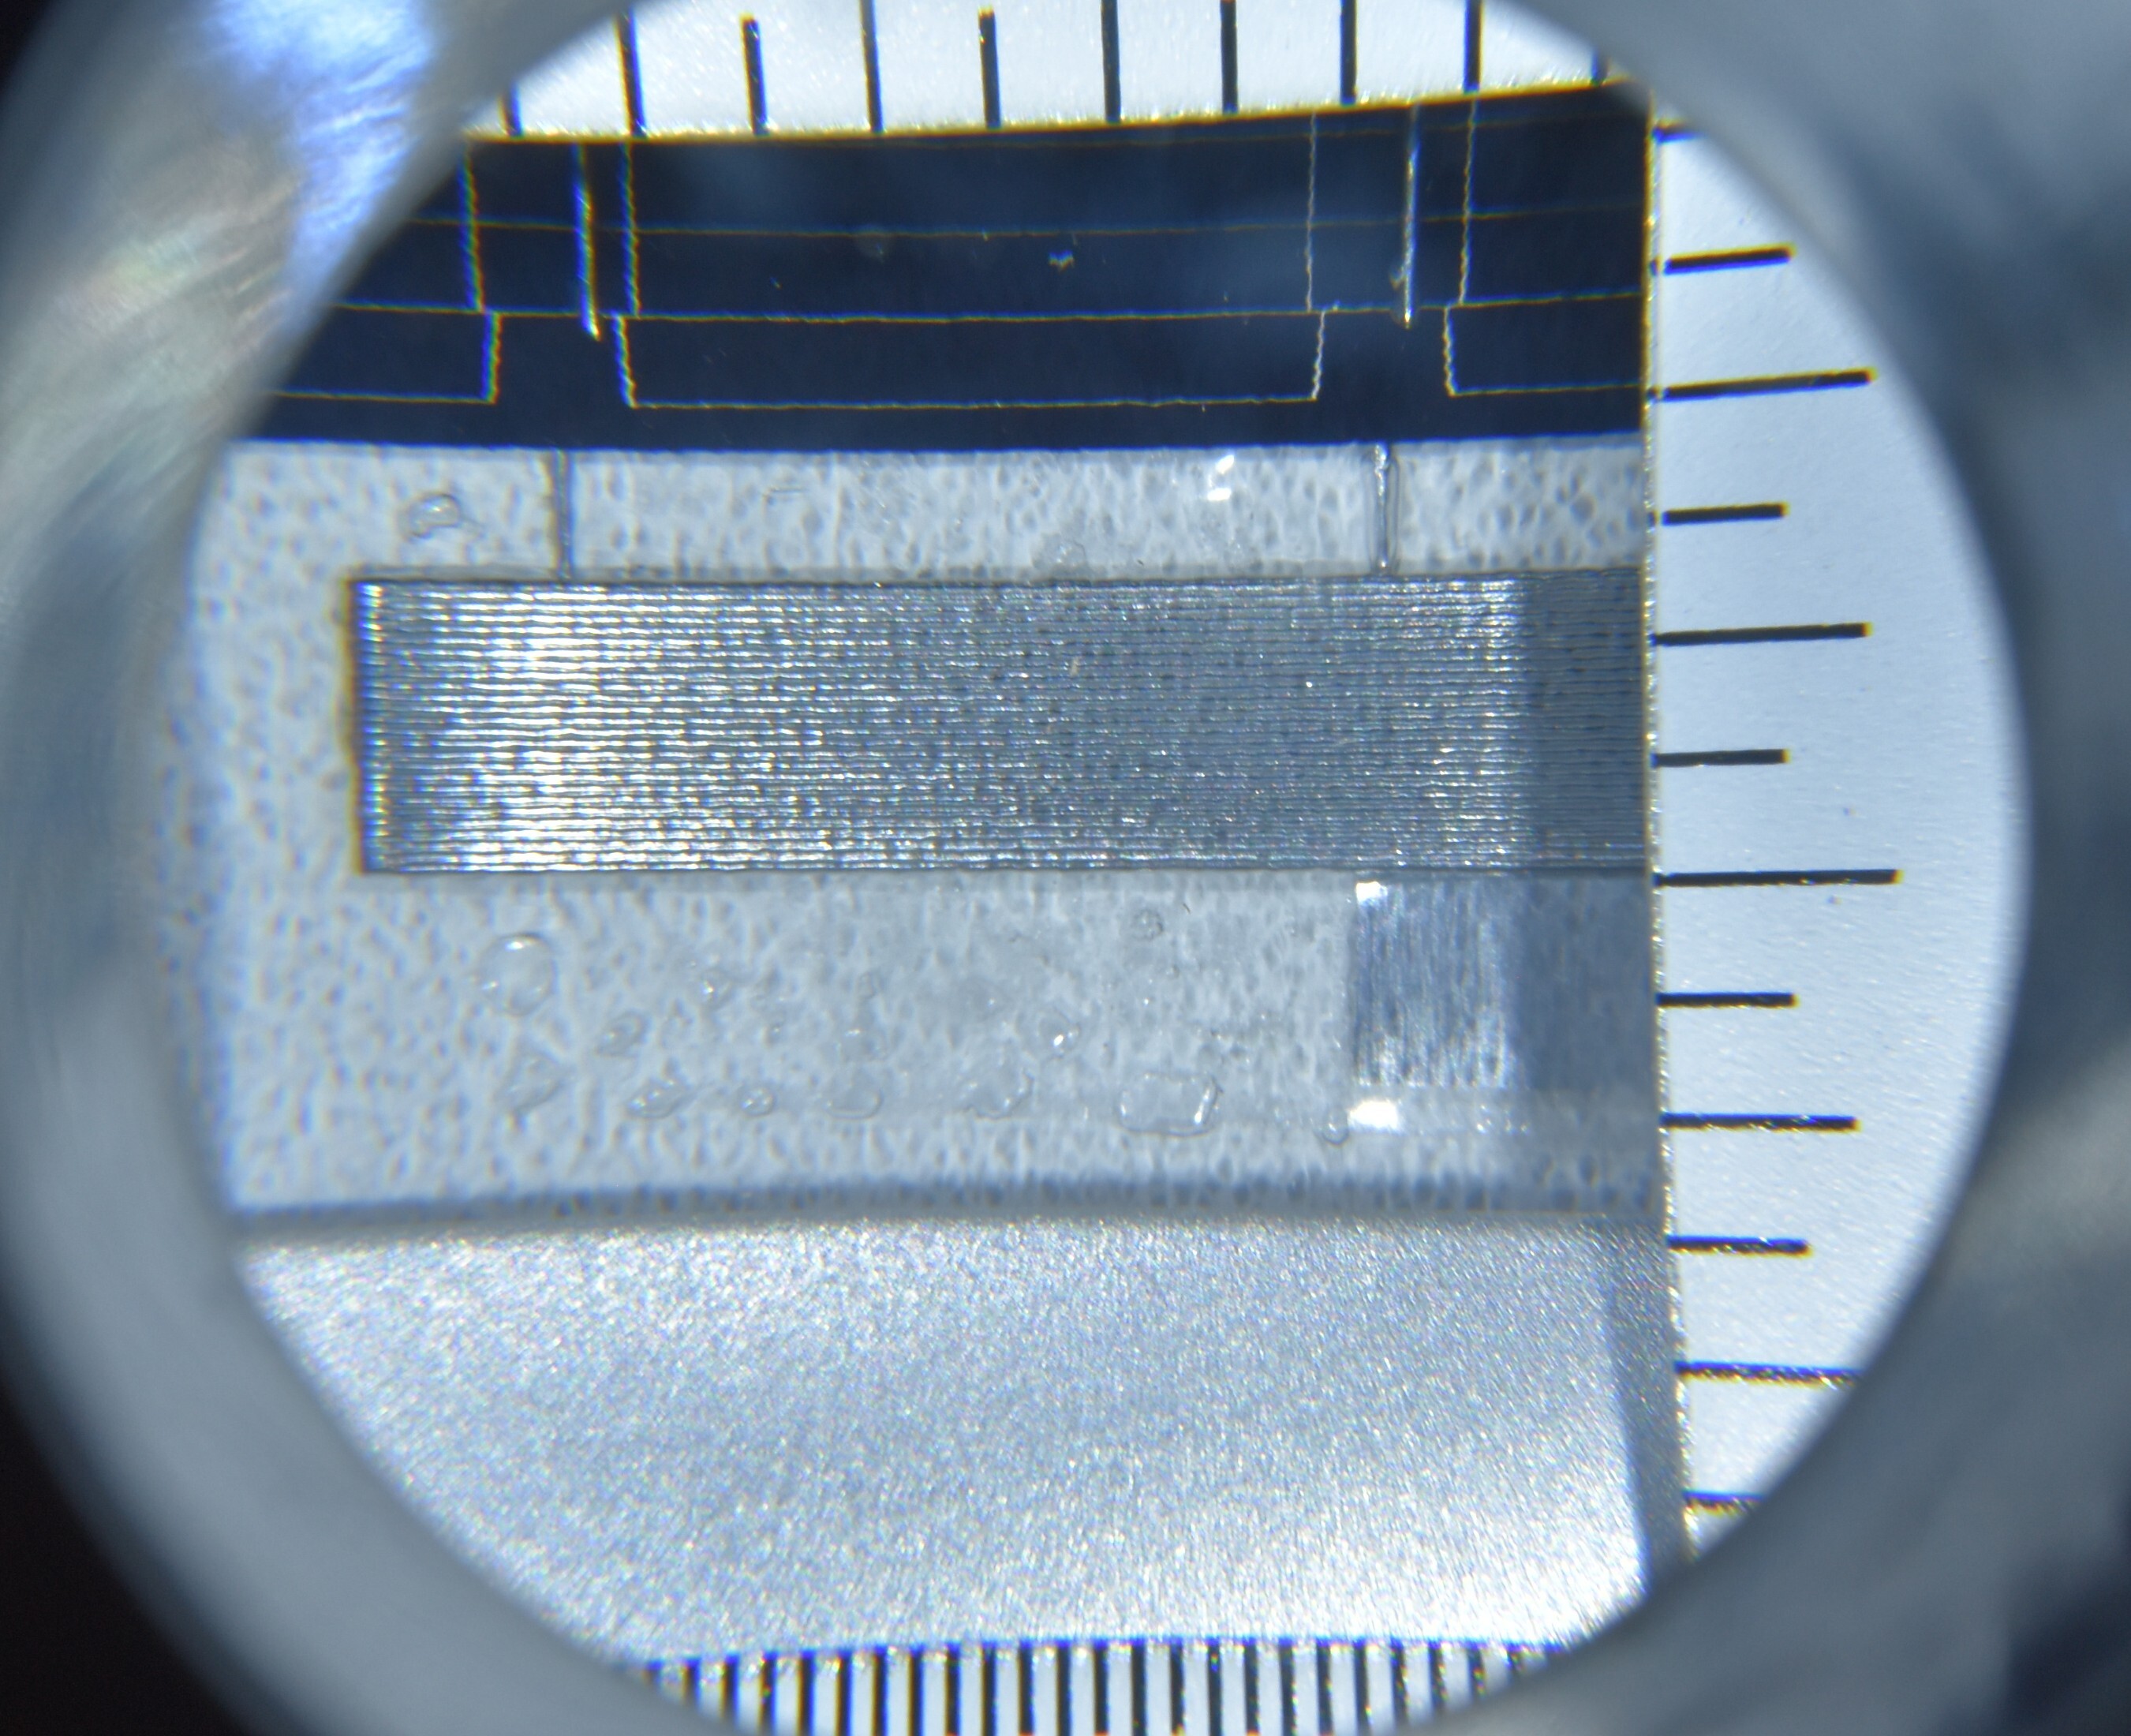
This module, as well as four others from the same BOM, was found to have an accumulation of bubbles/delamination along the module perimeter during initial characterizations. These bubbles are considered a major defect according to IEC 61730 due to their reduction of electrical insulation and creepage distances. 45% of manufacturers experienced at least one delamination failure over the past year of PQP testing.
Modules with power degradation failures may underperform in the field. Although the PQP does not assign specific pass/fail thresholds for degradation, manufacturers may initiate a retest if power loss exceeds their or their customers' expectations. Retests are clearly noted in PQP reports. BOMs that undergo a retest due to power loss are included in the Scorecard's failure statistics.
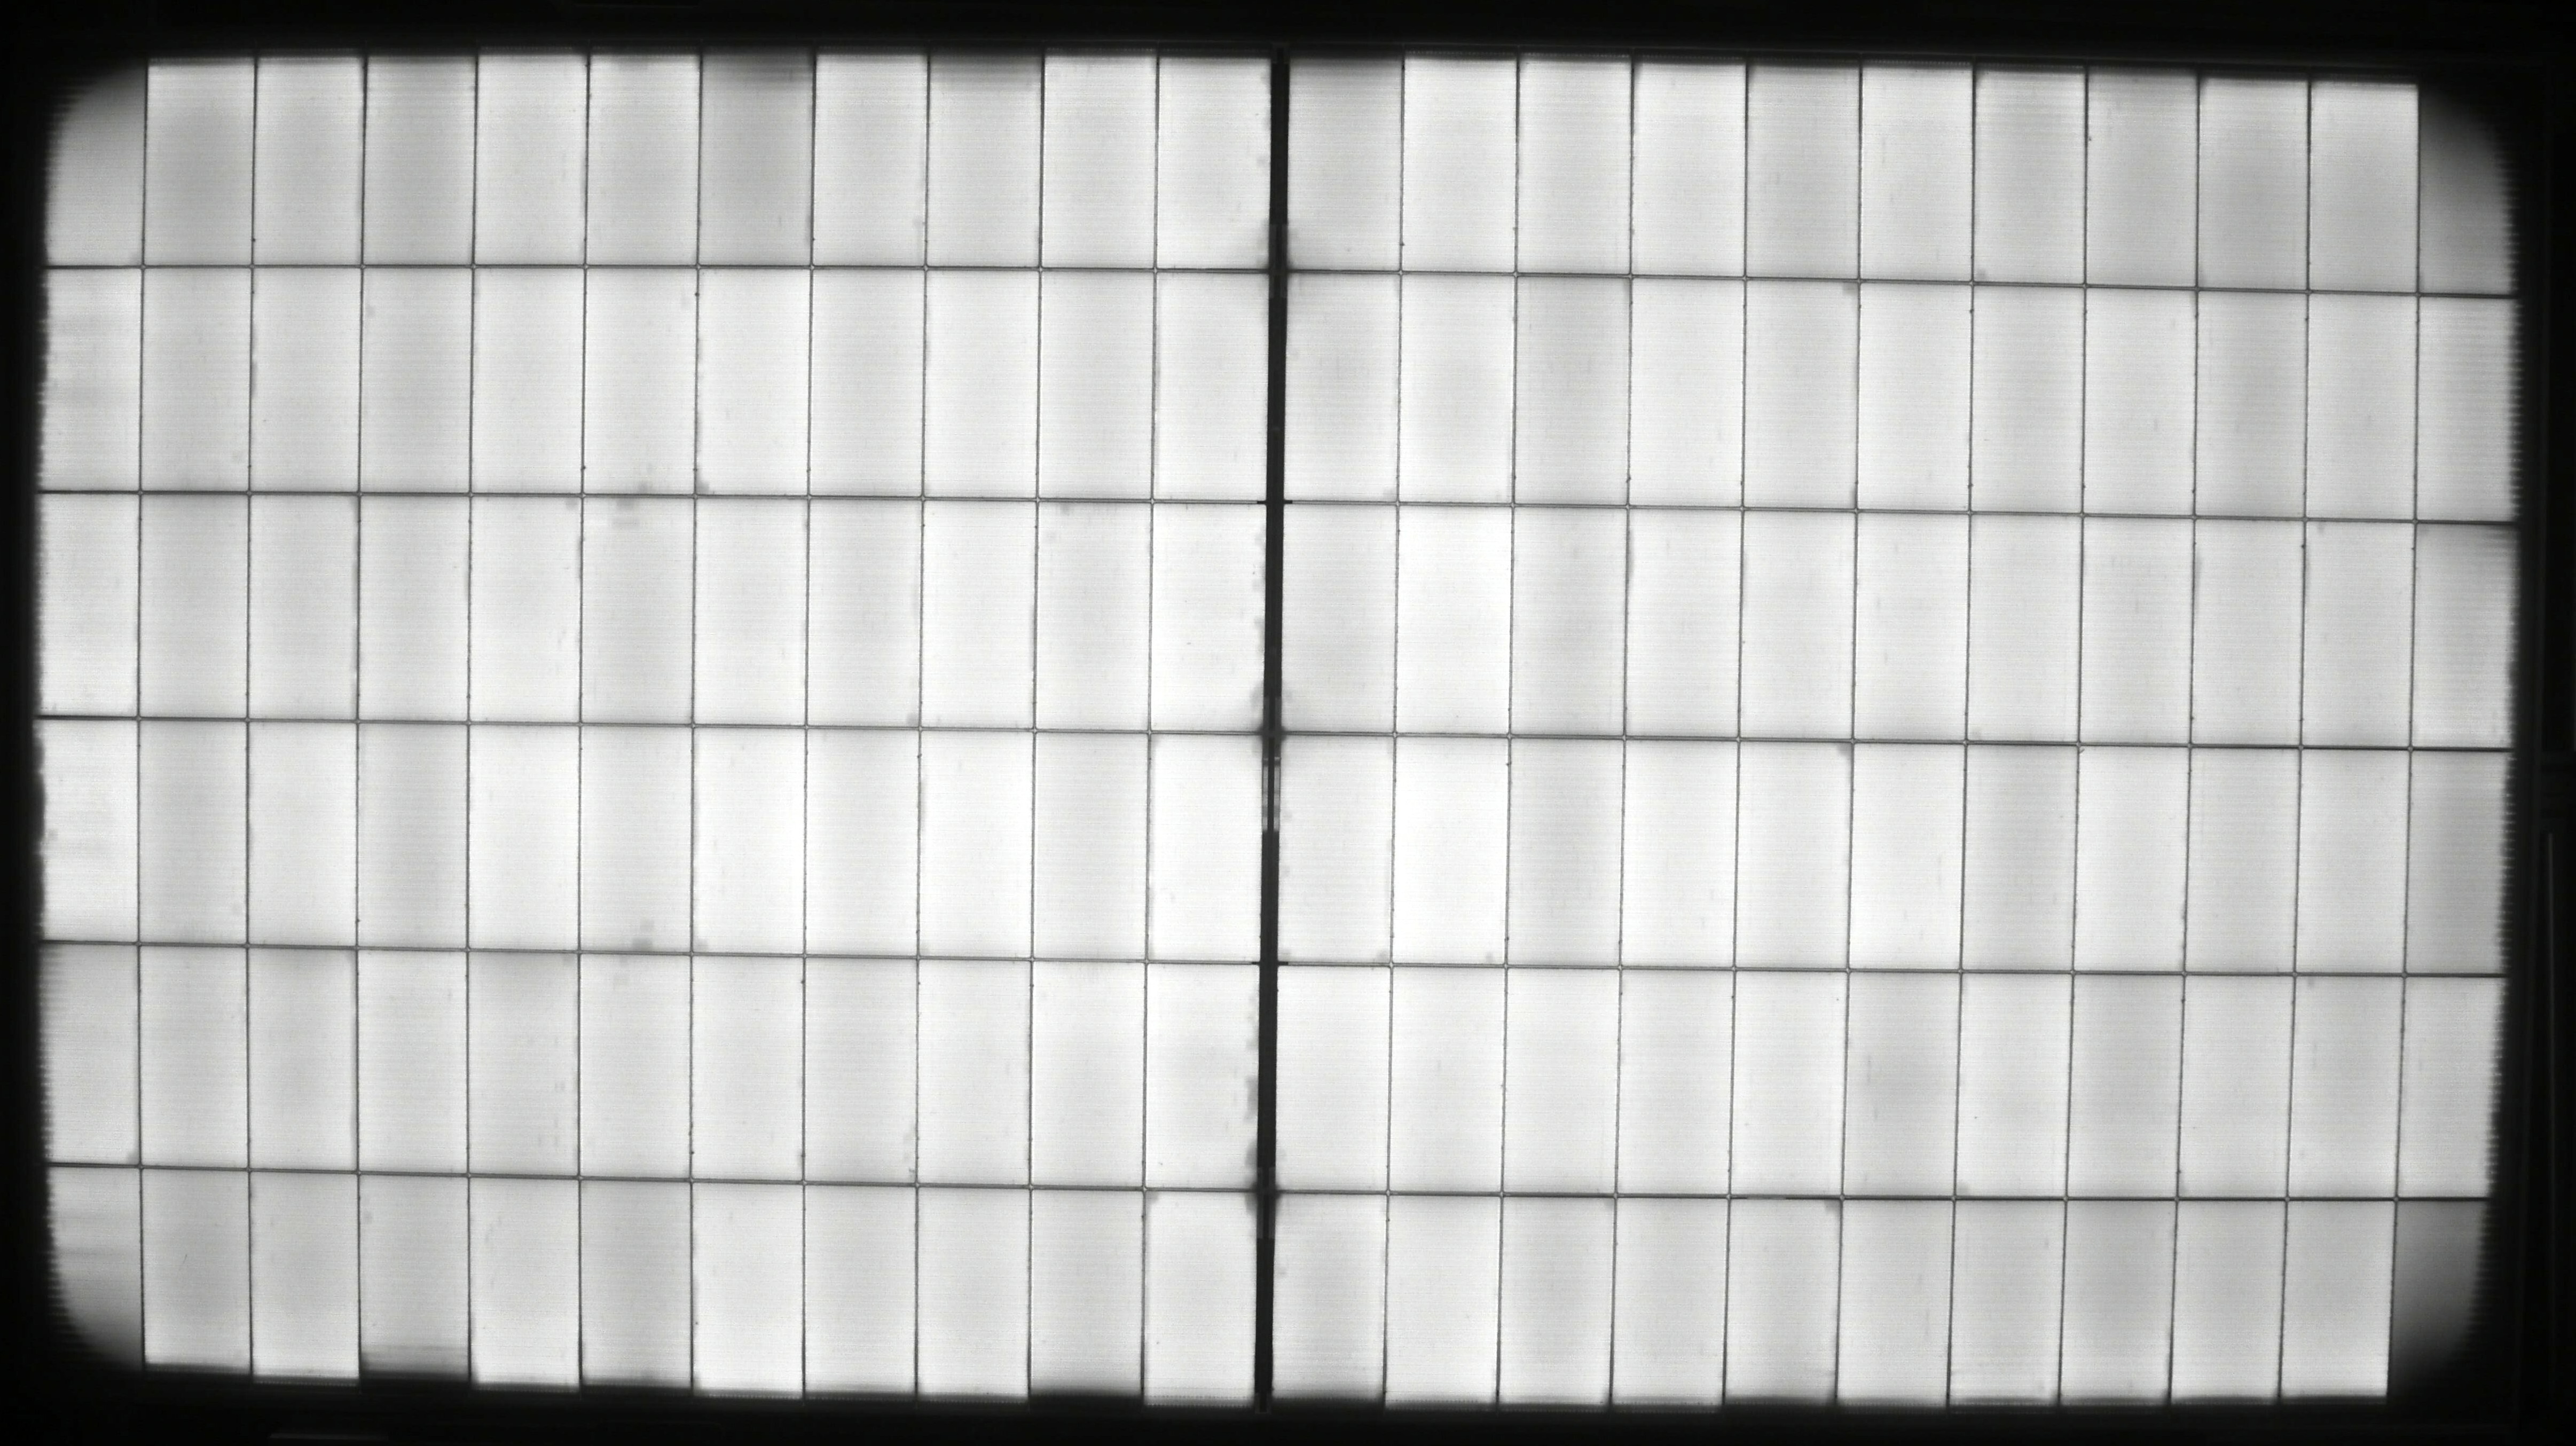
This HJT module was highlighted in the 2025 Scorecard after it degraded 5.5% following DH2000 testing, triggering a retest request by the manufacturer. Following that retest, this module degraded by 13.5%. The power loss was again caused by corrosion due to moisture entering the glass//glass laminate along the perimeter and at the junction box holes.
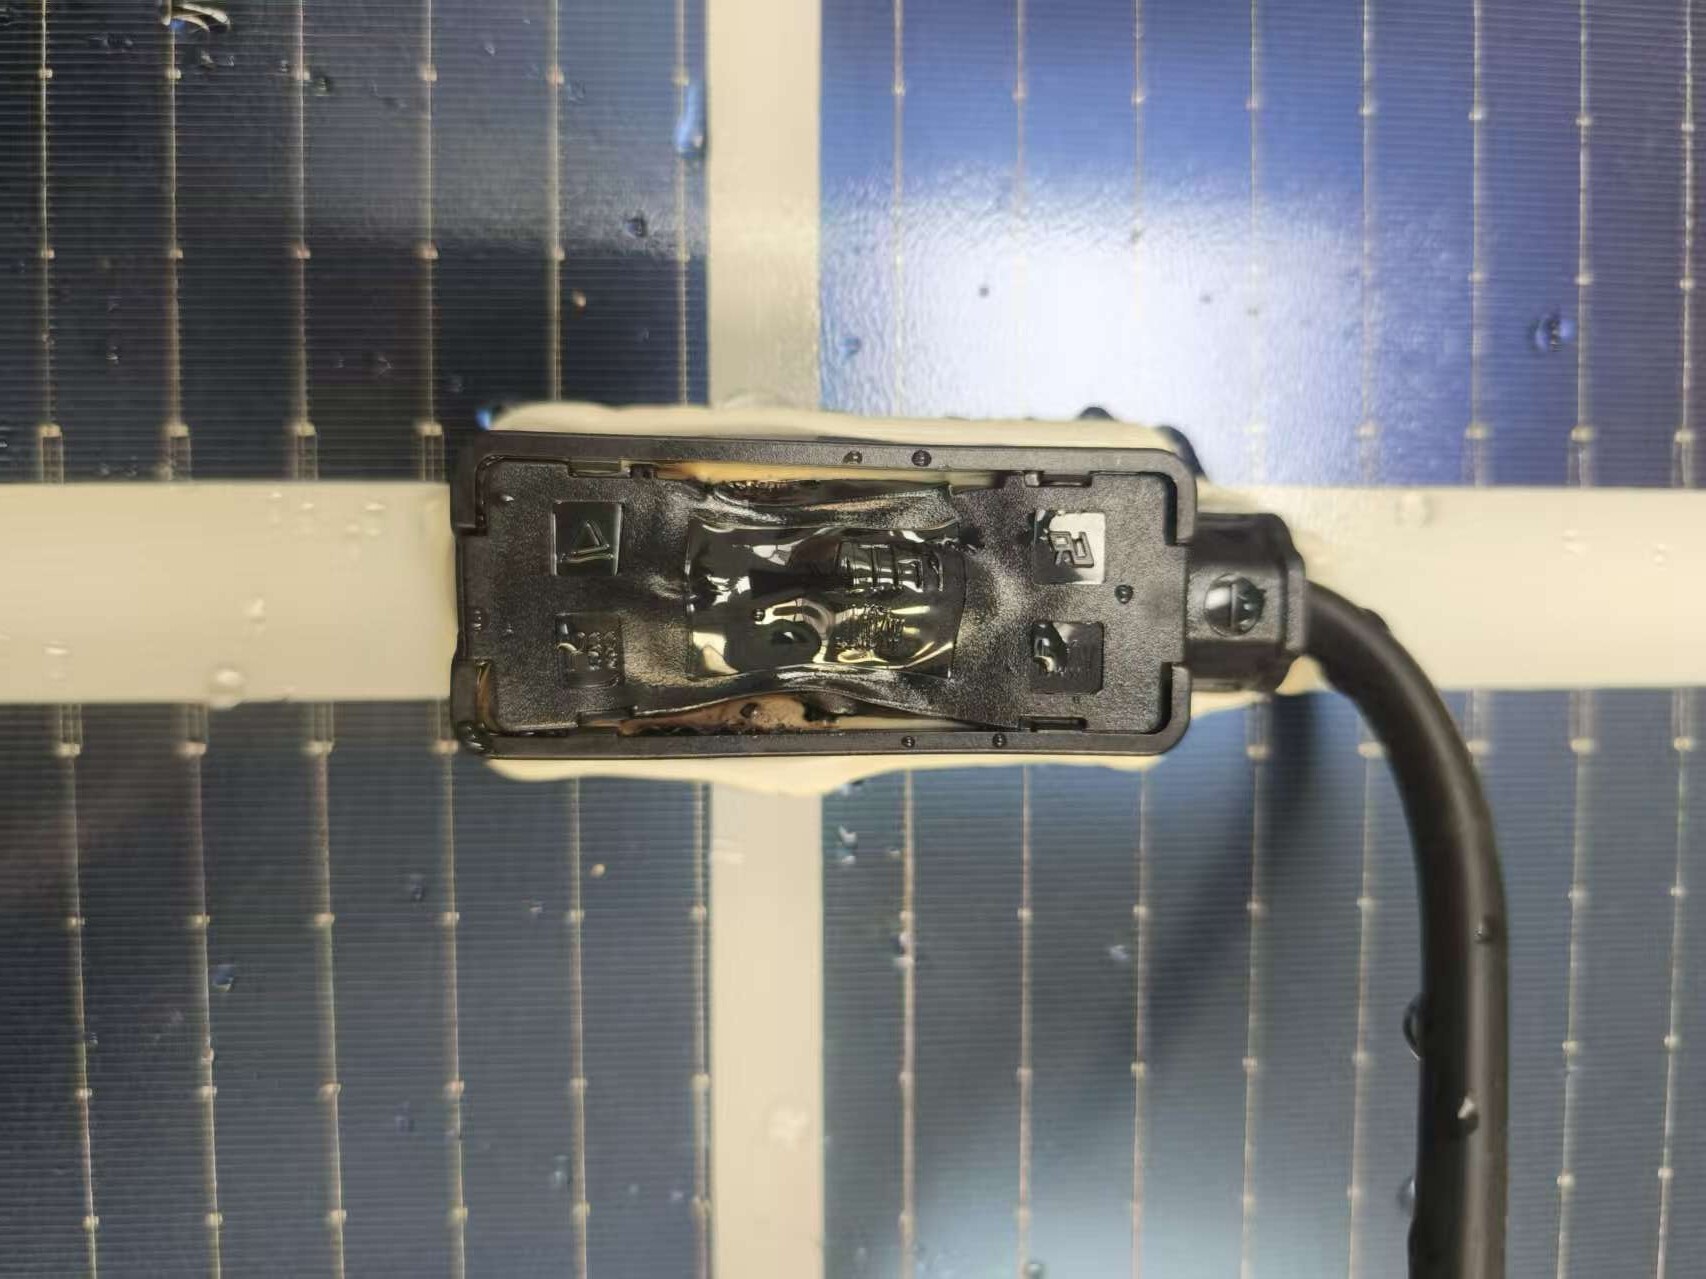
Kiwa PVEL evaluates the functionality of the module's bypass diodes after TC and MSS testing. A failed bypass diode can no longer protect the module from hot spots, which could lead to fire risk. BOMs with non-functioning diodes in reverse and/or forward bias are included in the Scorecard's failure statistics.
This module experienced melting of the bypass diode/junction box due to a short circuit after only TC200 (the IEC 61215 test duration). Kiwa has received an increasing number of reports of fielded modules experiencing junction box hot spots/melting, which have led to vegetation fires in some cases. 17% of manufacturers experienced at least one failed bypass diode in the past year of PQP testing.
29% of BOMs undergoing MSS experienced at least one module breaking. 23% of BOMs undergoing HSS experienced module breakage during HSS testing, which is counted as a PQP failure when modules break for both tested hail sizes or when the manufacturer requests an HSS retest. Improved designs, materials and processes are necessary to address the multiple potential causes for module breakage.
The percentage of manufacturers experiencing delamination failures tripled over the previous year. A third of these defects came after DH testing (either DH1000 or DH2000), but delamination failures were also observed during initial characterizations and after TC, MSS, PID and UVID. Better encapsulant and/or lamination processes are needed to solve this issue.
Junction box (JB) related failures decreased over the past year but still remain a significant source of PQP failures. These failures include 17% of manufacturers with bypass diode failures, 9% of manufacturers with a safety failure linked to the JB and 4% of manufacturers with JB covers falling off. These defects can be avoided with better bypass diodes, improved JB sealing and better JB designs.
40% of power loss failures occurred after PID, keeping it as the test with the highest occurrence of these failures. The number of UVID power loss failures decreased from the 2025 Scorecard as fewer manufacturers requested UVID retests. Power loss failures were also recorded following TC, DH, LID and after a failed PQP sample production factory witness.
The bar chart displays the percentage of BOMs experiencing at least one failure in each applicable test sequence of the PQP by failure type. New for 2026, the per-test failure rate has been calculated based on the number of BOMs that underwent that specific test, rather than based on the total number of 2026 Scorecard BOMs. This has caused the per-test failure rates to increase from previously calculated statistics, but it is a more accurate representation of how many BOMs experienced a failure for each test.
The most common type of failure is a visual inspection major defect, which accounts for 73% of all failures. Of the visual inspection failures, 50% are due to module breakage and 46% are due to delamination.
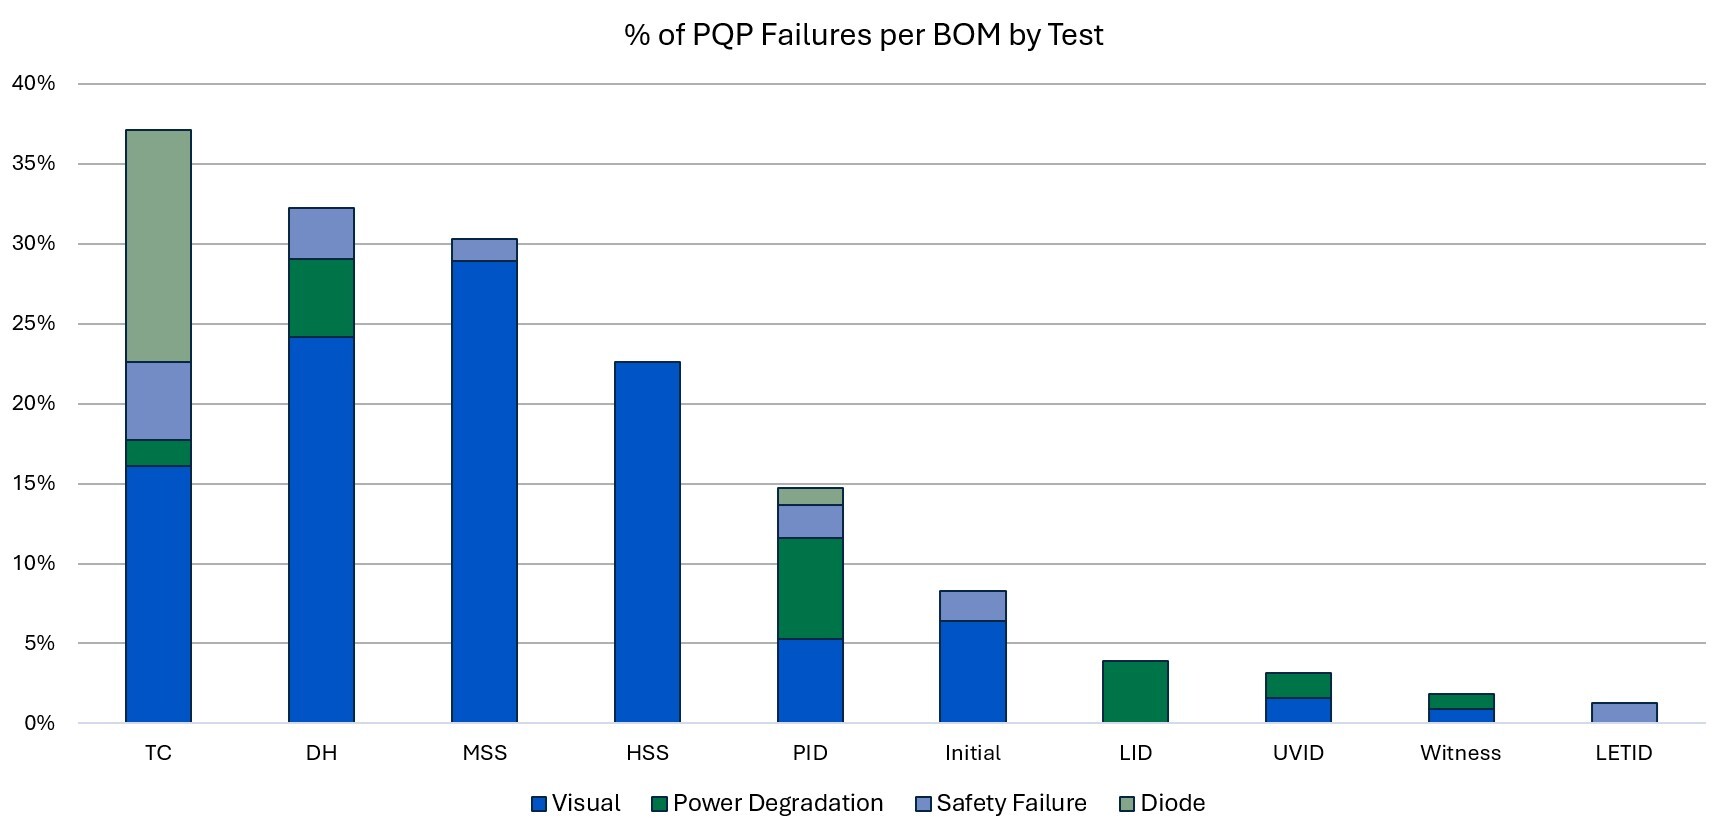
The percentage of PQP failures per BOM by test sequence. Initial failures are those that were detected during characterizations prior to stress-testing. Witness failures occurred when the manufacturer decided not to ship the modules following the PQP sample production factory witness due to a quality issue.
The history of reported failures across the past six Scorecards has been included in the line graph below. While the rate of increase has diminished, the percentage of manufacturers and BOMs experiencing at least one failure has hit a historic high. The peak in failure rates is despite the reduction in junction box related failures over the past year; however, junction box related failures remain some of the most impactful as seen in the diode failure example above.
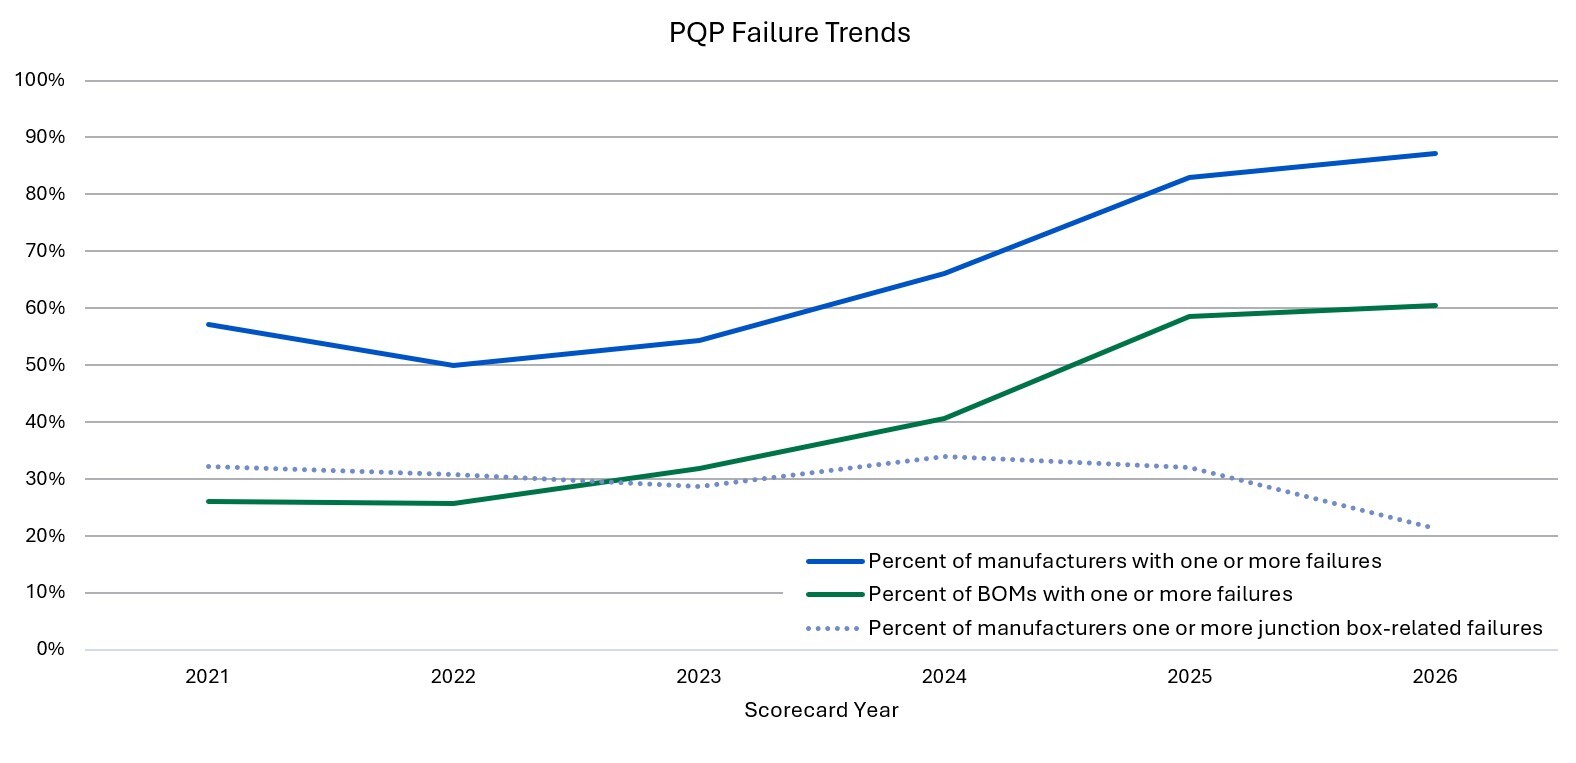
PQP failure rates as reported in past Scorecards.
Premium Partners receive full BOM-level data every quarter.