Become a Kiwa PVEL Premium Partner
Premium Partners receive full BOM-level data every quarter.
Energy yields in Kiwa PVEL’s measured PAN results continue to increase, showing once again that modern modules are not just higher power, but also higher energy. This improvement came from an increase in the proportion of n-type modules in the 2026 Scorecard dataset, which offer better temperature coefficients and bifaciality.
BOMS THAT ARE PAN TOP PERFORMERS
MANUFACTURERS THAT ARE PAN TOP PERFORMERS
INCREASE IN AVERAGE ENERGY YIELD
Kiwa PVEL’s PAN testing and .pan file generation enhance PV module performance simulations by using empirical data across a range of temperature and irradiance conditions. This is an essential input for accurate energy models. Unlike manufacturer-provided .pan files, which might lack empirical validation, Kiwa PVEL's comprehensive testing ensures .pan files reflect real-world conditions more accurately, supporting better decision-making in module procurement and project development.
Energy yields improved again over the past year with more TOPCon BOMs included in the PAN dataset. The result was the Top Performer threshold for PAN increasing by 0.34% and 0.53% for Kiwa PVEL’s modelled sites in Las Vegas and Boston, respectively (or 0.43% average).
The median TOPCon Pmp temperature coefficient over the past three years improved slightly, from -0.30%°C to -0.29%°C. This is still behind xBC’s and HJT’s median Pmp temperature coefficients (of -0.27%/°C and -0.26%/°C, respectively), but better than PERC’s (at -0.32%/°C). Better temperature coefficients result in higher energy yields, especially for higher temperature sites.
The median bifaciality over the past three years was 70.2% for PERC, 70.8% for xBC, 76.5% for TOPCon, and 86.2% for HJT. TOPCon bifaciality is expected to increase over the coming year as more manufacturers implement poly-finger cell designs. Higher bifaciality leads to higher energy yields, especially for sites with high albedo.
The ranges in low light performance (as measured via the relative efficiency deviation at 200 W/m² compared to 1000 W/m²) remain fairly aligned across PERC, TOPCon, HJT and xBC. Over the past three years, the median low light performance was -5.4% for xBC, -3.8% of TOPCon, -3.6% for PERC and -3.5% for PERC.
HJT’s temperature coefficients and bifaciality advantages are clear across the past three years of test results. And while HJT is clearly ahead of TOPCon for these performance characteristics, TOPCon has obvious advantages over PERC. The limited number of xBC BOMs show temperature coefficients over TOPCon and PERC but behind HJT; however, xBC is behind with a wide range for bifaciality. Kiwa PVEL’s low light performance results show strong overlap across all four technologies with a wider range of values across individual HJT and xBC BOMs than for PERC and TOPCon BOMs.
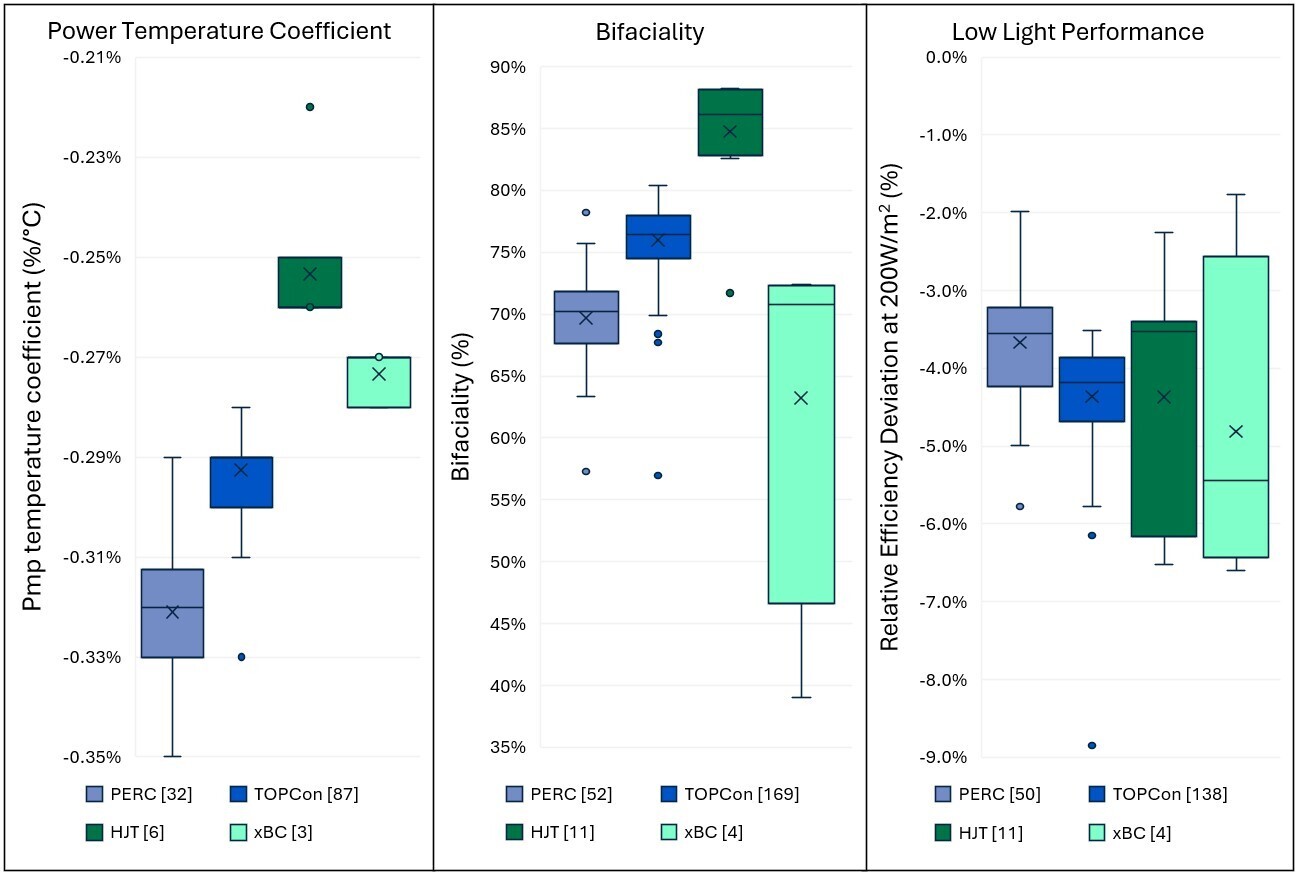
Key PAN file parameters of power temperature coefficient, bifaciality and low light performance results from PQP BOMs produced from 2023 to 2025. BOM quantity per test and per technology are shown in square brackets. Note the HJT and xBC sample size is significantly lower than PERC and TOPCon.
View Box Plot Interpretation Guide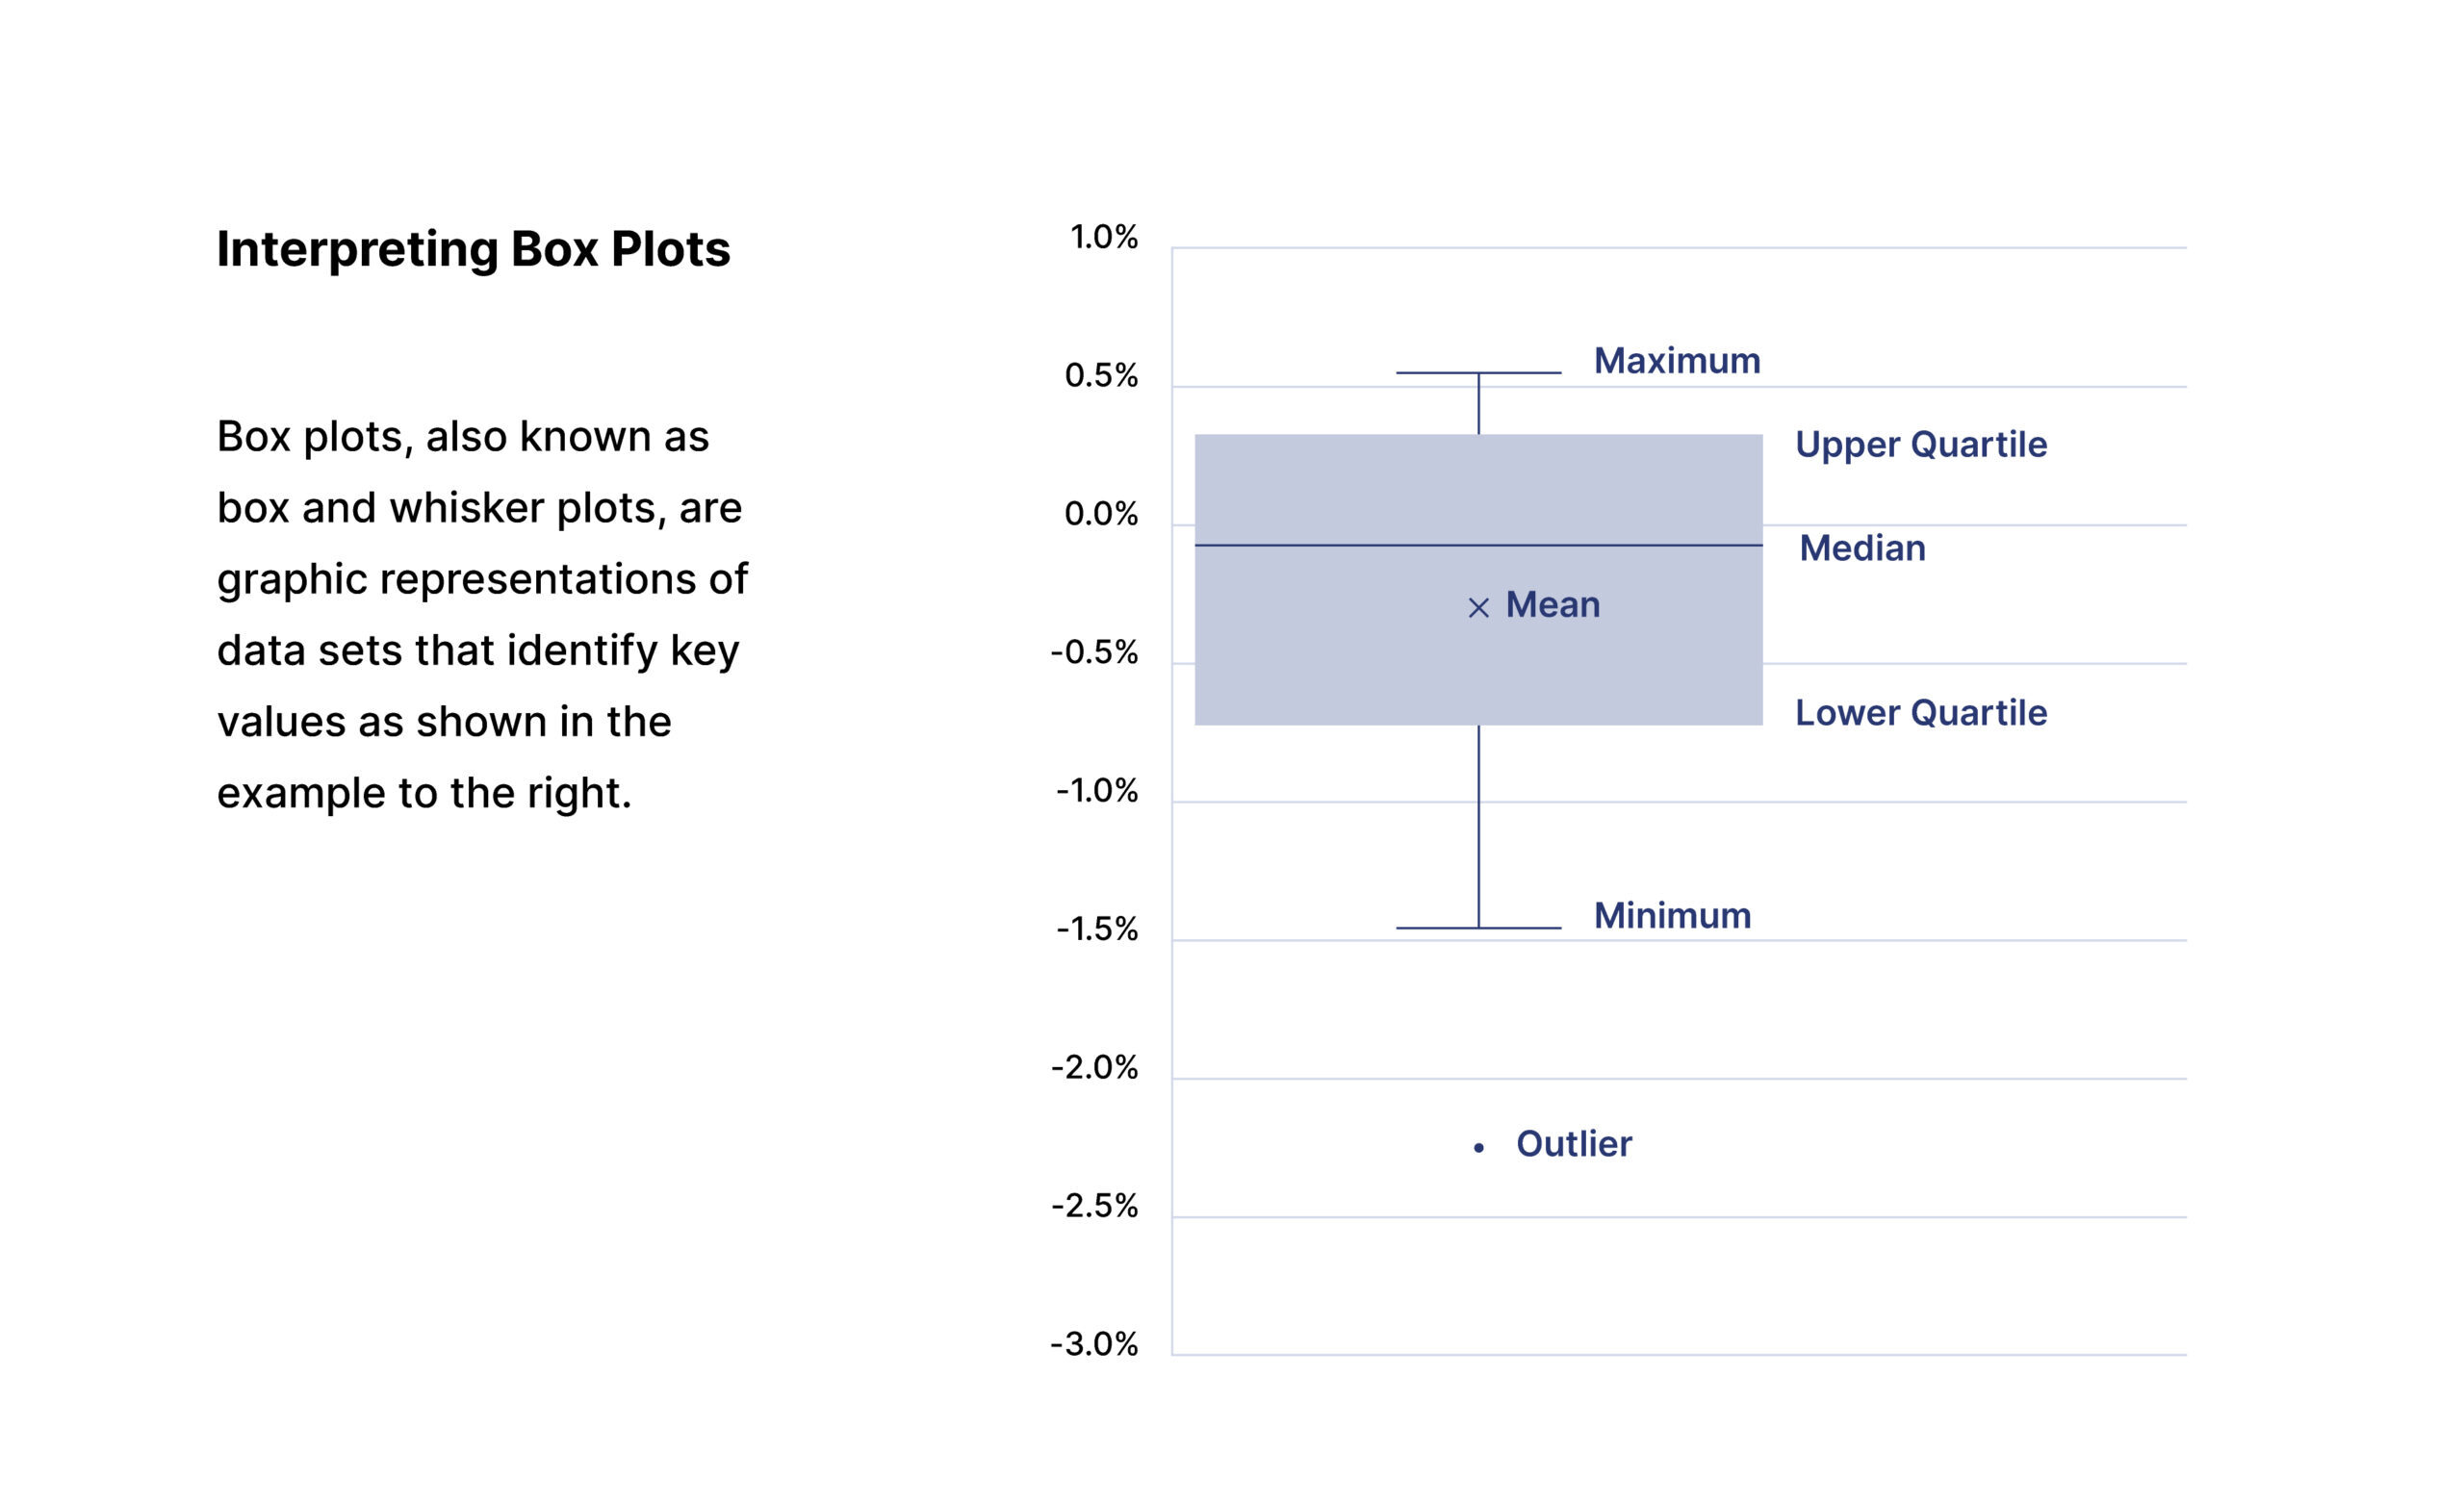
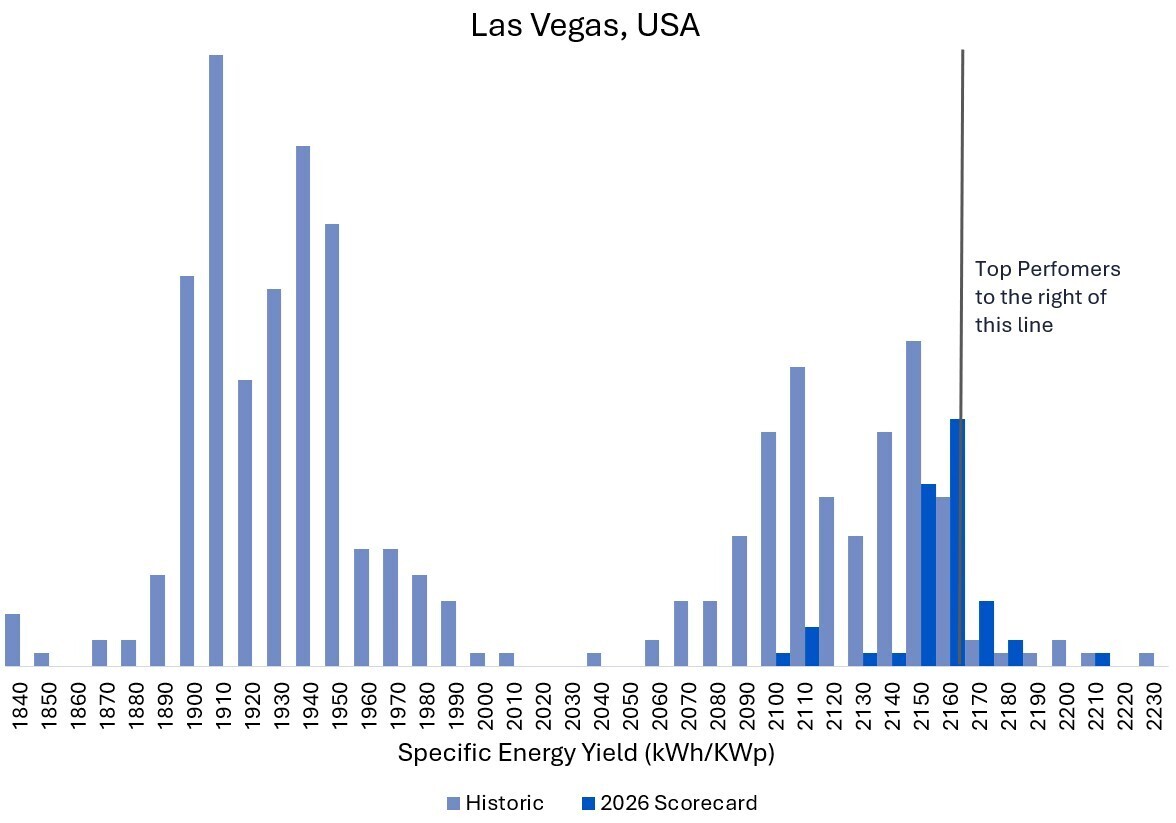
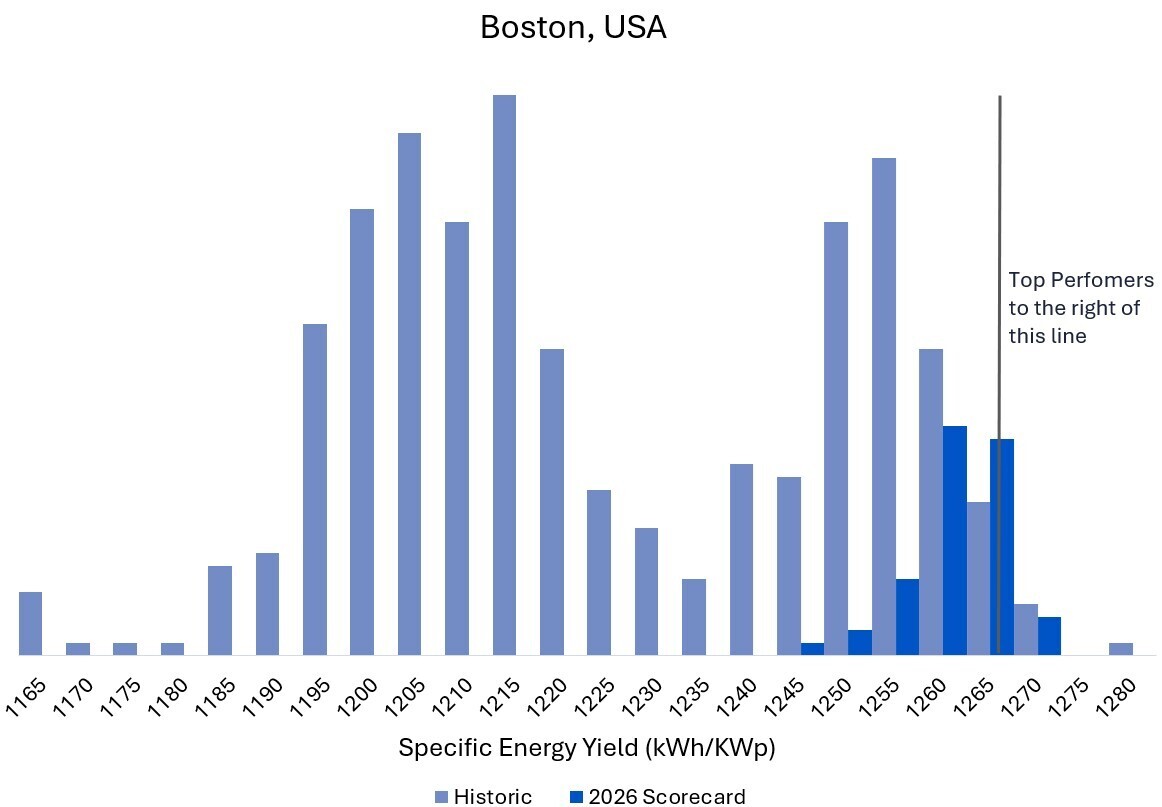
To illustrate the impact of Kiwa PVEL’s PAN files, each PAN report includes simulations based on the Kiwa PVEL-generated PAN file for two sites: a 1 MW site in a temperate climate at a 0° tilt in Boston, USA, and a 1 MW site in a desert climate at 20° tilt in Las Vegas, USA. The PAN reports also include single-axis tracker simulations for the same locations. The result of each of these simulations is a specific energy yield (kWh/kWp) value which can be used for benchmarking purposes.
Premium Partners receive full BOM-level data every quarter.