1 Kiwa PVEL has <0.5% total expanded uncertainty up to 60 degrees AOI (angle of incidence). In prior work comparing IAM uncertainty2 other labs self-reported total-expanded uncertainty ranges from 1.2% to 2.5% up to 60 degrees AOI.
Key Takeaways
Tight Distribution
Kiwa PVEL measured minimal variation in IAM performance across dozens of modules.
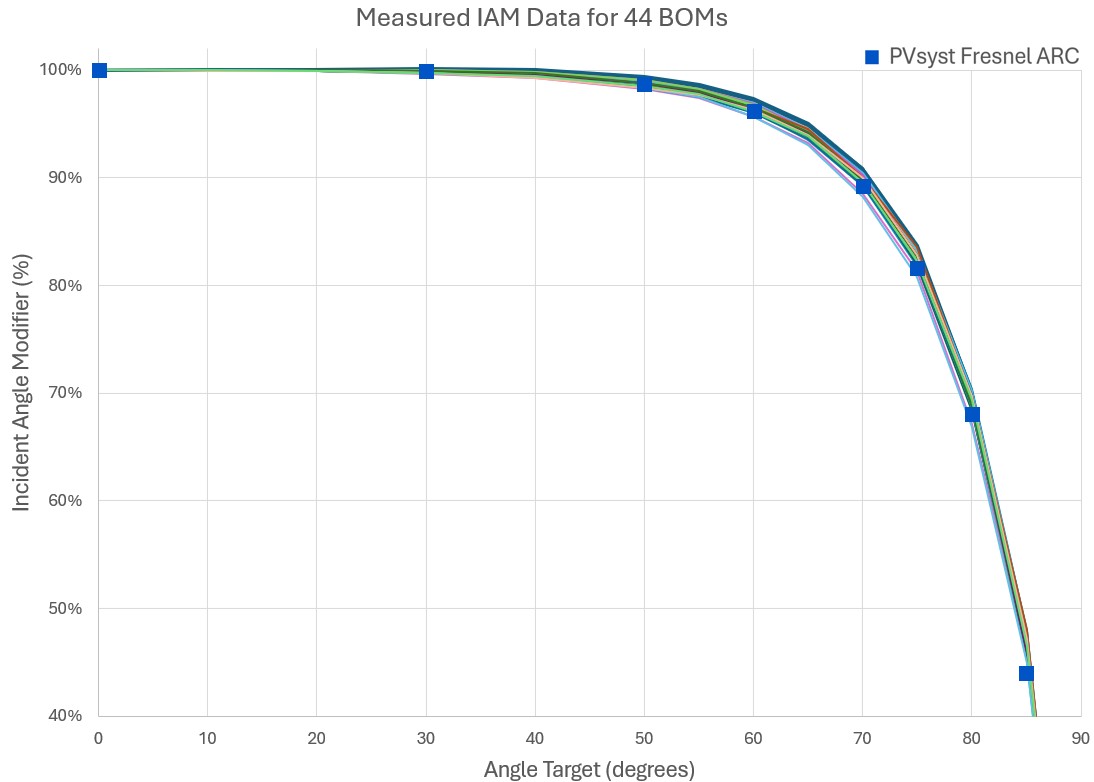
Measurements over the past year using Kiwa PVEL’s best-in-class test method continued to show that the IAM values for commercial modules are relatively aligned. This may contradict manufacturer provided IAM curves, including those from some other third-party labs. See the Measured IAM Across Test Fleet for more.
Meaningful Differences
The range of results may be less than some expect, but notable differences exist.
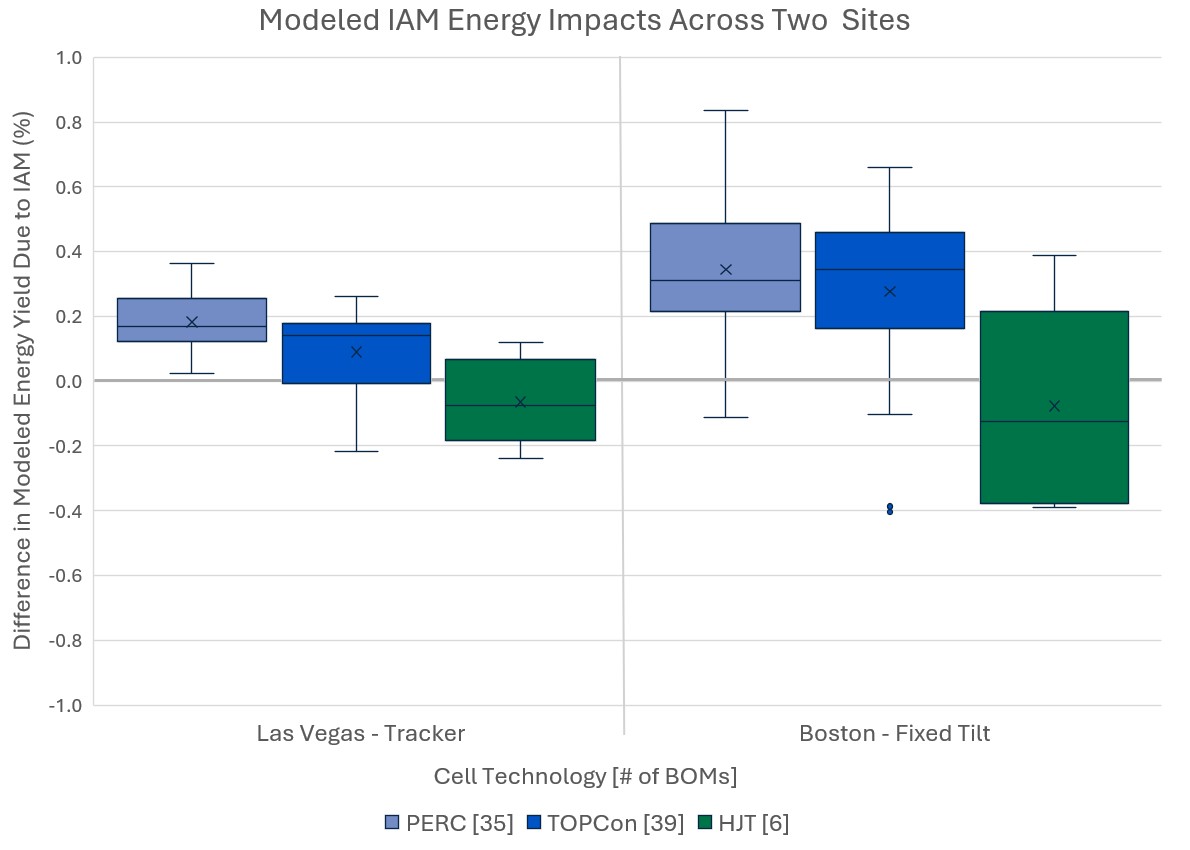
With the highest accuracy IAM test in the world1, Kiwa PVEL can accurately measure differences in IAM performance between BOMs. The highest performer’s modelled energy yield was 0.60% higher than the lowest performer for a simulated single-axis tracker site in Las Vegas, USA. See the Test Results Spotlight for more.

Comparison to Default
PVsyst default IAM values are slightly lower than most measured IAM results.
For a simulated single-axis tracking system modeled in Las Vegas, USA, the typical module Kiwa PVEL measured over the past year had a 0.12% higher energy yield compared to PVsyst’s Fresnel ARC default. This difference is more pronounced in fixed tilt and cloudier conditions. See the Test Results Spotlight for more.
Cell Technology Impacts
On average, IAM values of HJT modules are lower than that of TOPCon and PERC.
While the sample size was lower for HJT, Kiwa PVEL’s IAM measurements indicate that HJT modules on average have a lower IAM than TOPCon and PERC modules. This is likely due to the blue light absorption in the amorphous silicon for HJT cells. See the Test Results Spotlight for more.
IAM Test Result Spotlight
Despite relatively tight alignment in IAM measurements, the differences between BOMs can still be significant for project energy and financial models. These differences become more pronounced in fixed-tilt, higher latitude and/or cloudy locations (such as Boston, USA) compared to sunnier, single-axis tracker sites at lower latitudes (such as Las Vegas, USA). Kiwa PVEL has also discovered some cell technology dependence in IAM testing trends. While overlap exists, especially between PERC and TOPCon, the average and median measured IAM for both of those cell technologies performed better than the average and median HJT module. Again, these differences become more significant for the fixed-tilt Boston simulation.
The impacts by cell technology to modeled energy yield for measured IAM compared to PVsyst Fresnel ARC default (represented as 0.0) at two simulated sites, using the same IAM datasets for both sites.
Measured IAM Across Test Fleet
Kiwa PVEL’s IAM measurements on 44 BOMs (with three samples measured per BOM) over the past year continue to show a relatively tight alignment. On average, these measurements overperform the PVsyst Fresnel ARC default across all angles of incidence.
Kiwa PVEL’s IAM test results for 44 BOMs from 2024 and Q1’2025 show strong consistency. PVsyst’s Fresnel ARC default included for reference.
2 Riedel-Lyngskær N, Santamaría Lancia AA, Plag F, et al. Interlaboratory comparison of angular-dependent photovoltaic device measurements: Results and impact on energy rating. Prog Photovolt Res Appl. 2021; 29: 315–333. https://doi.org/10.1002/pip.3365

